实例介绍
【实例截图】
【核心代码】
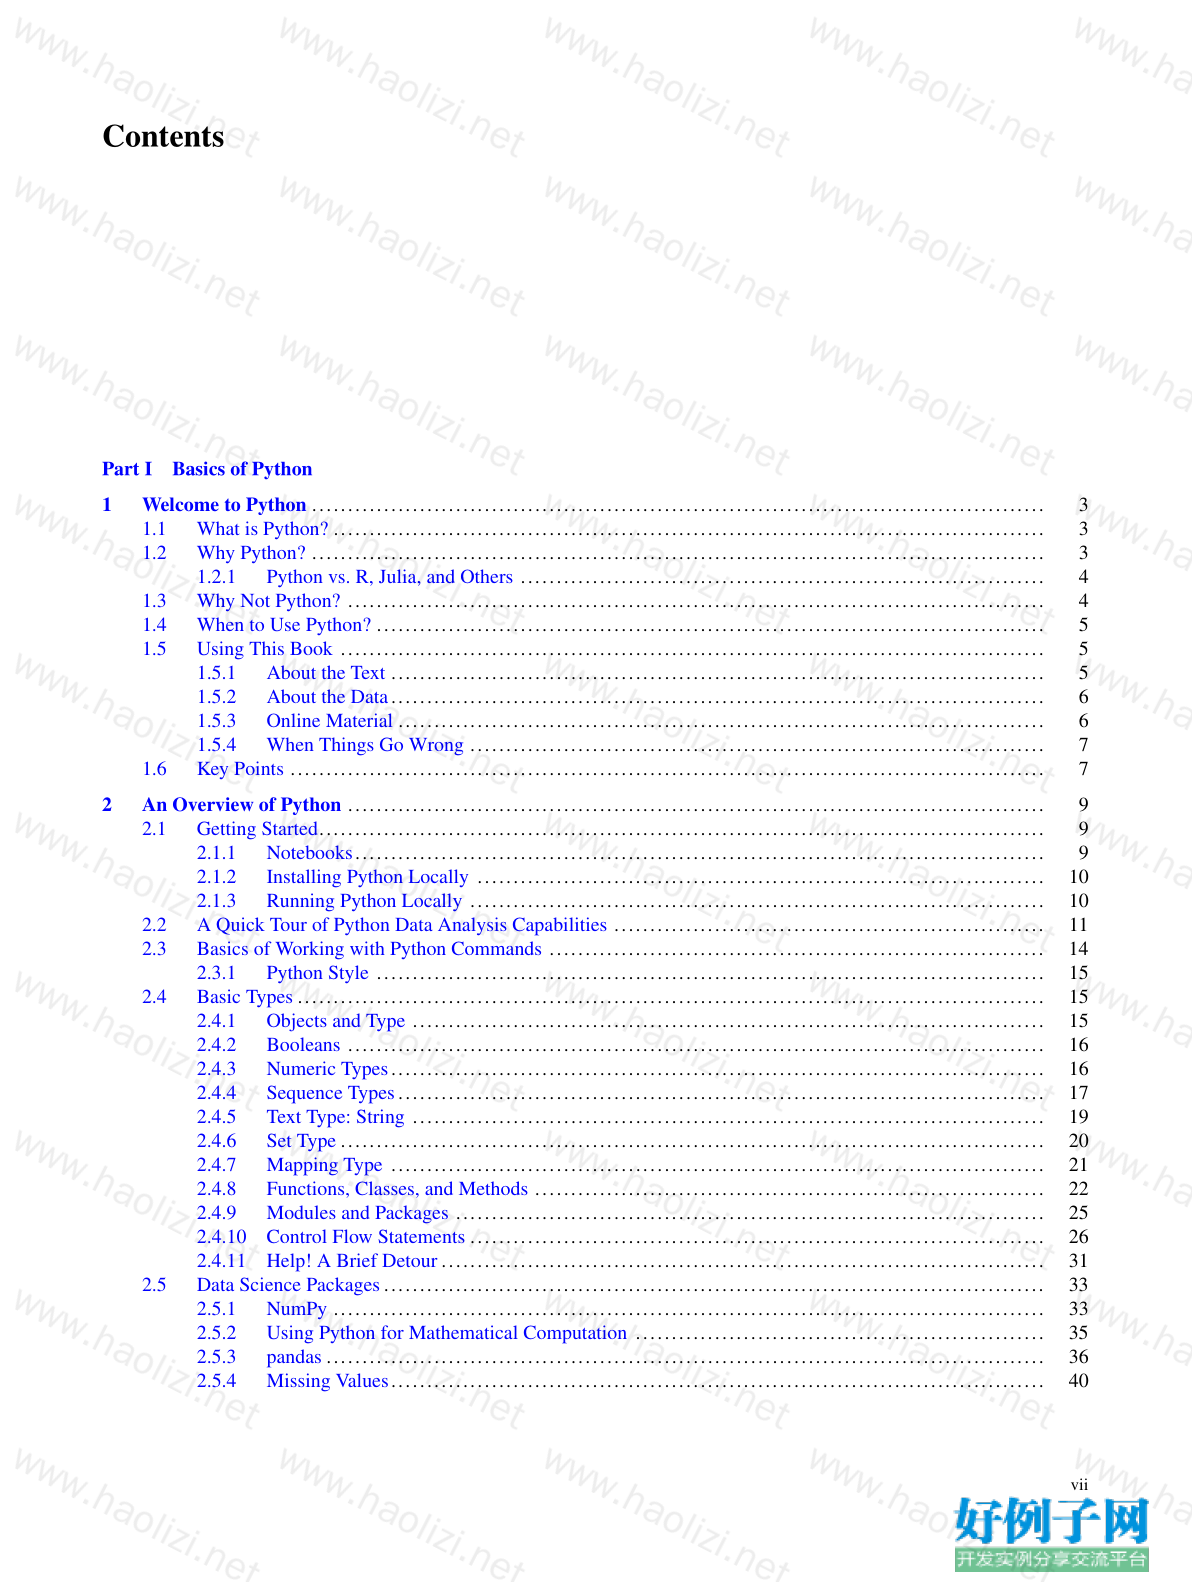
Contents
Part I Basics of Python
1 Welcome to Python ...................................................................................................... 3
1.1 What is Python? ................................................................................................... 3
1.2 Why Python? ...................................................................................................... 3
1.2.1 Python vs. R, Julia, and Others ......................................................................... 4
1.3 Why Not Python? ................................................................................................. 4
1.4 When to Use Python? ............................................................................................. 5
1.5 Using This Book .................................................................................................. 5
1.5.1 About the Text ........................................................................................... 5
1.5.2 About the Data........................................................................................... 6
1.5.3 Online Material .......................................................................................... 6
1.5.4 When Things Go Wrong ................................................................................ 7
1.6 Key Points ......................................................................................................... 7
2 An Overview of Python ................................................................................................. 9
2.1 Getting Started..................................................................................................... 9
2.1.1 Notebooks................................................................................................ 9
2.1.2 Installing Python Locally ............................................................................... 10
2.1.3 Running Python Locally ................................................................................ 10
2.2 A Quick Tour of Python Data Analysis Capabilities ............................................................ 11
2.3 Basics of Working with Python Commands ..................................................................... 14
2.3.1 Python Style ............................................................................................. 15
2.4 Basic Types ........................................................................................................ 15
2.4.1 Objects and Type ........................................................................................ 15
2.4.2 Booleans ................................................................................................. 16
2.4.3 Numeric Types........................................................................................... 16
2.4.4 Sequence Types.......................................................................................... 17
2.4.5 Text Type: String ........................................................................................ 19
2.4.6 Set Type .................................................................................................. 20
2.4.7 Mapping Type ........................................................................................... 21
2.4.8 Functions, Classes, and Methods ....................................................................... 22
2.4.9 Modules and Packages .................................................................................. 25
2.4.10 Control Flow Statements ................................................................................ 26
2.4.11 Help! A Brief Detour.................................................................................... 31
2.5 Data Science Packages............................................................................................ 33
2.5.1 NumPy ................................................................................................... 33
2.5.2 Using Python for Mathematical Computation ......................................................... 35
2.5.3 pandas .................................................................................................... 36
2.5.4 Missing Values........................................................................................... 40
vii
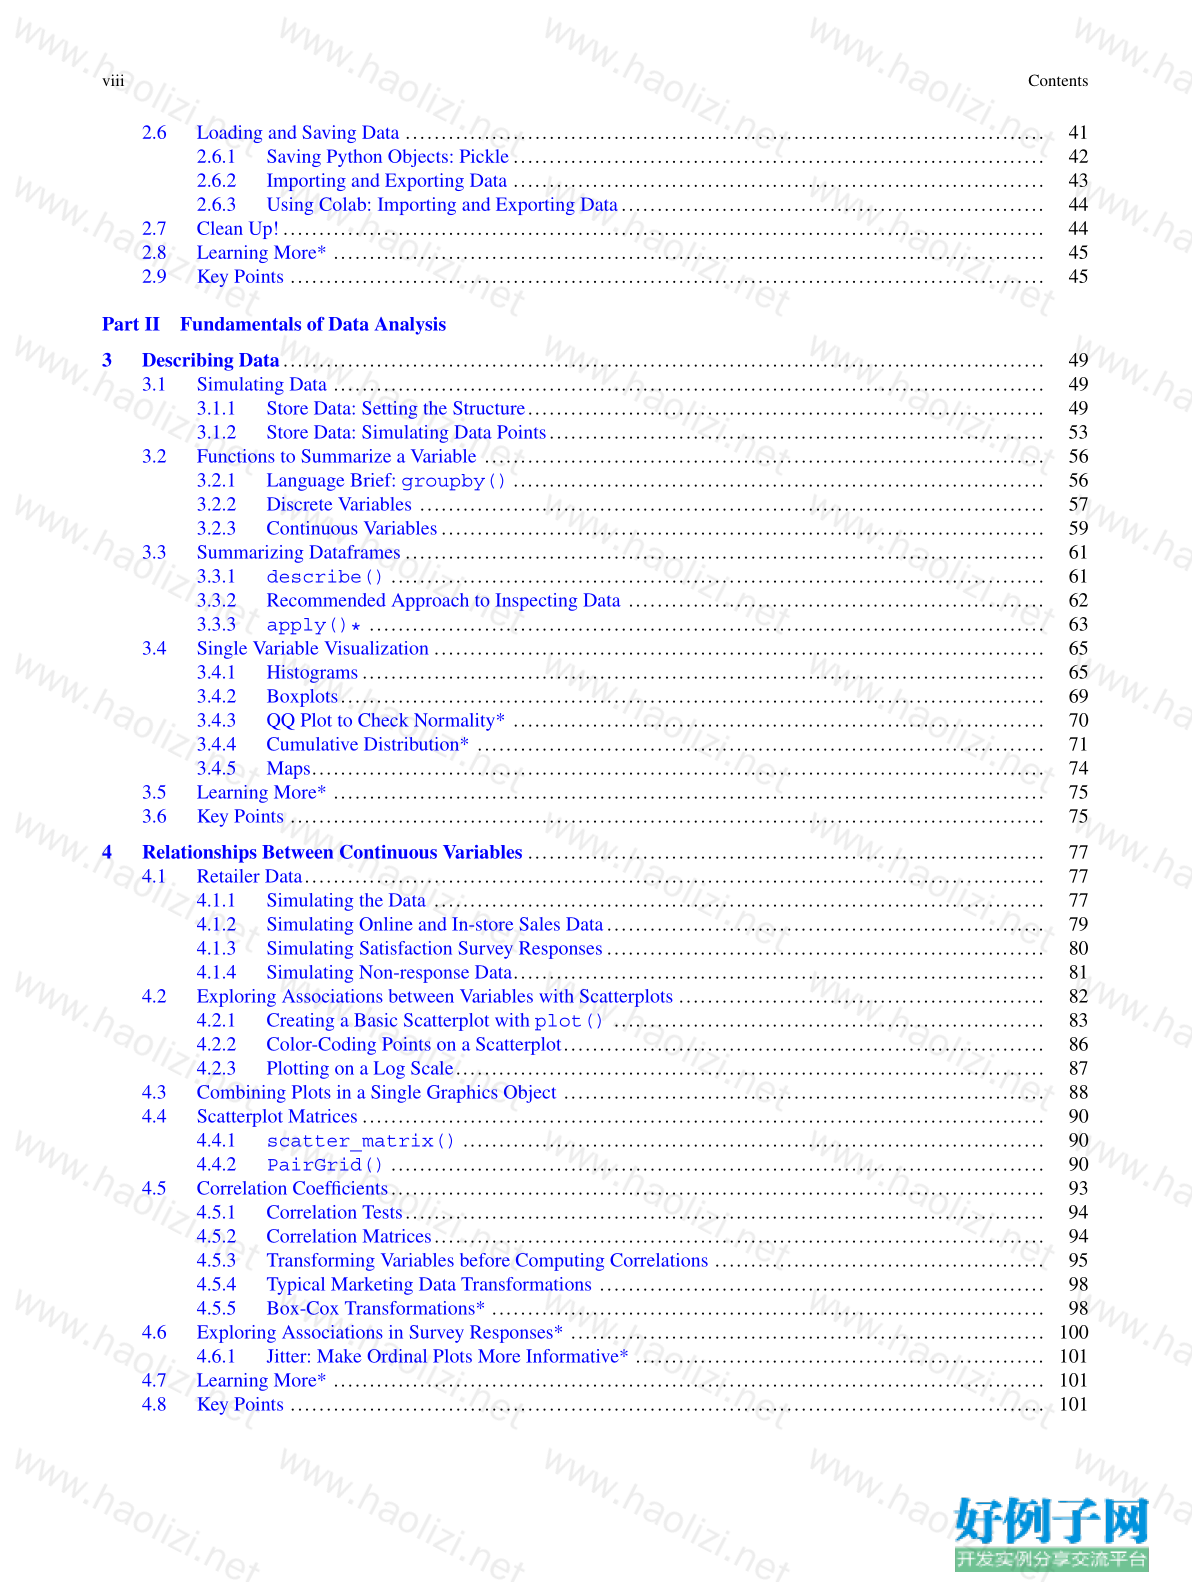
viii Contents
2.6 Loading and Saving Data ......................................................................................... 41
2.6.1 Saving Python Objects: Pickle .......................................................................... 42
2.6.2 Importing and Exporting Data .......................................................................... 43
2.6.3 Using Colab: Importing and Exporting Data........................................................... 44
2.7 Clean Up!.......................................................................................................... 44
2.8 Learning More* ................................................................................................... 45
2.9 Key Points ......................................................................................................... 45
Part II Fundamentals of Data Analysis
3 Describing Data.......................................................................................................... 49
3.1 Simulating Data ................................................................................................... 49
3.1.1 Store Data: Setting the Structure........................................................................ 49
3.1.2 Store Data: Simulating Data Points..................................................................... 53
3.2 Functions to Summarize a Variable .............................................................................. 56
3.2.1 Language Brief: groupby() .......................................................................... 56
3.2.2 Discrete Variables ....................................................................................... 57
3.2.3 Continuous Variables.................................................................................... 59
3.3 Summarizing Dataframes ......................................................................................... 61
3.3.1 describe() ........................................................................................... 61
3.3.2 Recommended Approach to Inspecting Data .......................................................... 62
3.3.3 apply() * .............................................................................................. 63
3.4 Single Variable Visualization ..................................................................................... 65
3.4.1 Histograms............................................................................................... 65
3.4.2 Boxplots.................................................................................................. 69
3.4.3 QQ Plot to Check Normality* .......................................................................... 70
3.4.4 Cumulative Distribution* ............................................................................... 71
3.4.5 Maps...................................................................................................... 74
3.5 Learning More* ................................................................................................... 75
3.6 Key Points ......................................................................................................... 75
4 Relationships Between Continuous Variables ........................................................................ 77
4.1 Retailer Data....................................................................................................... 77
4.1.1 Simulating the Data ..................................................................................... 77
4.1.2 Simulating Online and In-store Sales Data............................................................. 79
4.1.3 Simulating Satisfaction Survey Responses ............................................................. 80
4.1.4 Simulating Non-response Data.......................................................................... 81
4.2 Exploring Associations between Variables with Scatterplots ................................................... 82
4.2.1 Creating a Basic Scatterplot with plot() ............................................................ 83
4.2.2 Color-Coding Points on a Scatterplot................................................................... 86
4.2.3 Plotting on a Log Scale.................................................................................. 87
4.3 Combining Plots in a Single Graphics Object ................................................................... 88
4.4 Scatterplot Matrices ............................................................................................... 90
4.4.1 scatter_matrix() ................................................................................. 90
4.4.2 PairGrid() ........................................................................................... 90
4.5 Correlation Coefficients........................................................................................... 93
4.5.1 Correlation Tests......................................................................................... 94
4.5.2 Correlation Matrices..................................................................................... 94
4.5.3 Transforming Variables before Computing Correlations .............................................. 95
4.5.4 Typical Marketing Data Transformations .............................................................. 98
4.5.5 Box-Cox Transformations* ............................................................................. 98
4.6 Exploring Associations in Survey Responses* .................................................................. 100
4.6.1 Jitter: Make Ordinal Plots More Informative* ......................................................... 101
4.7 Learning More* ................................................................................................... 101
4.8 Key Points ......................................................................................................... 101
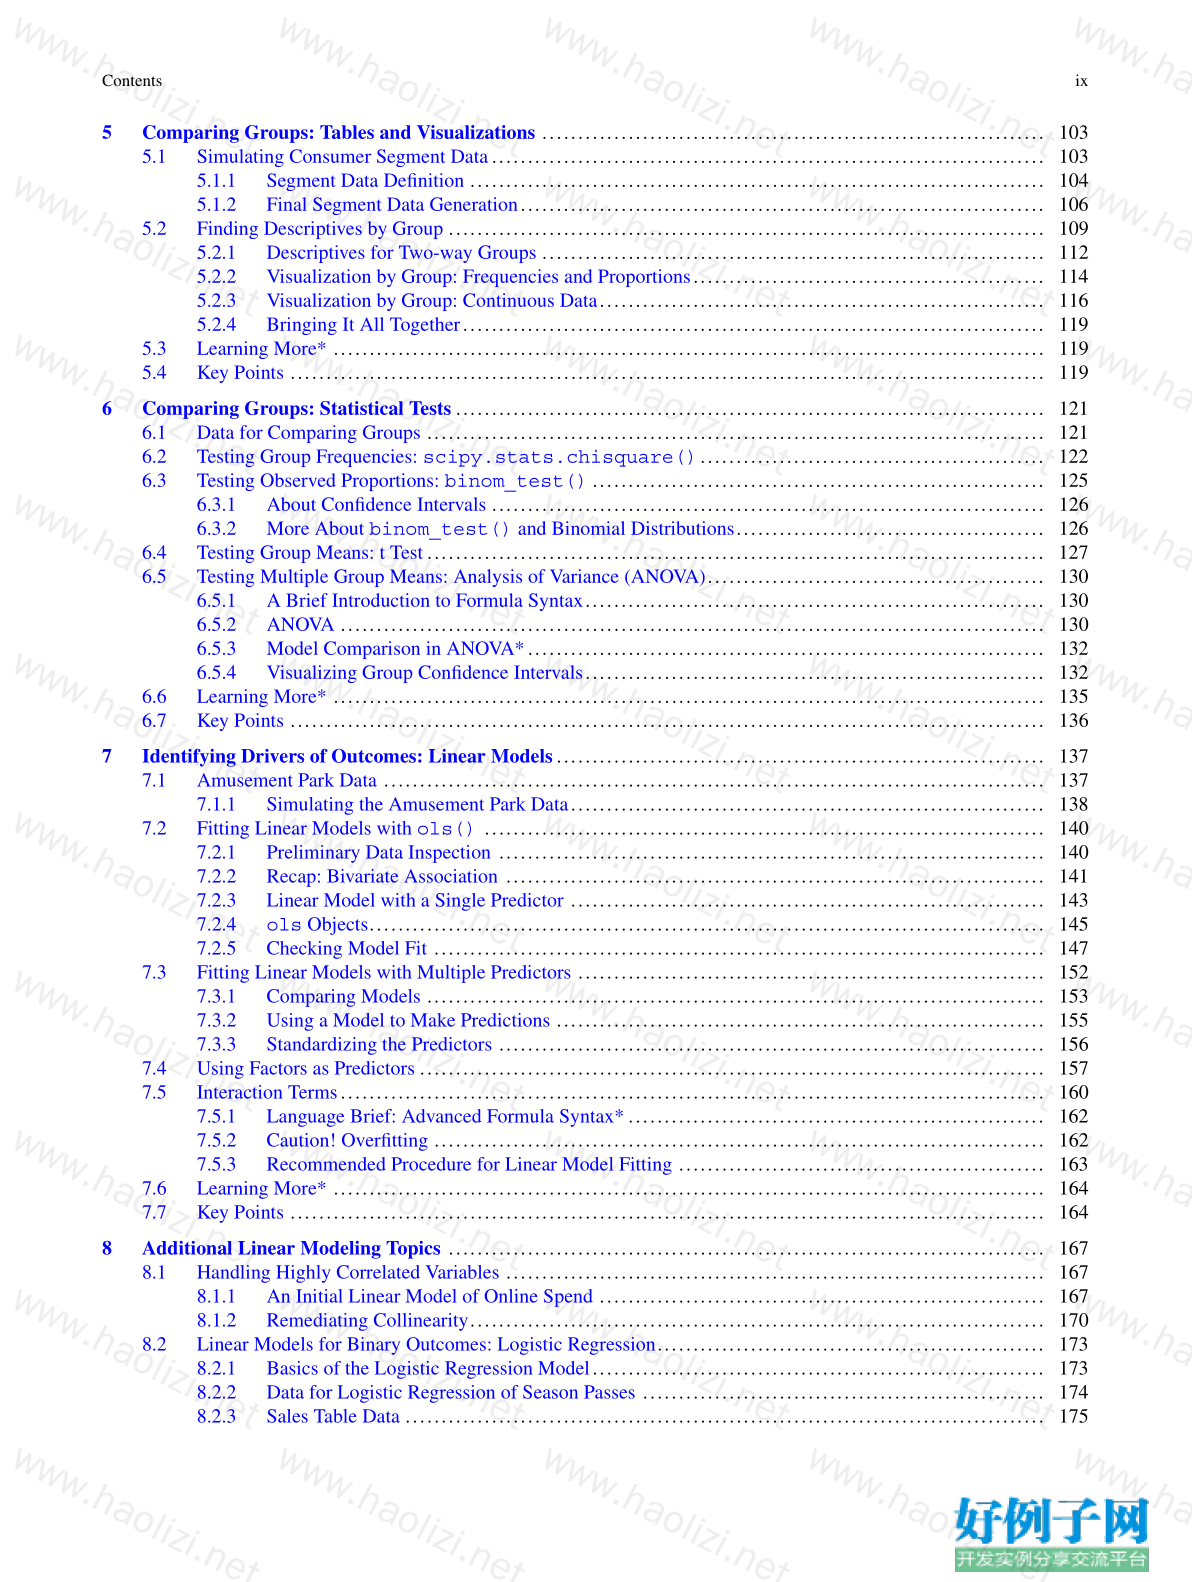
Contents ix
5 Comparing Groups: Tables and Visualizations ...................................................................... 103
5.1 Simulating Consumer Segment Data............................................................................. 103
5.1.1 Segment Data Definition ................................................................................ 104
5.1.2 Final Segment Data Generation......................................................................... 106
5.2 Finding Descriptives by Group ................................................................................... 109
5.2.1 Descriptives for Two-way Groups ...................................................................... 112
5.2.2 Visualization by Group: Frequencies and Proportions................................................. 114
5.2.3 Visualization by Group: Continuous Data.............................................................. 116
5.2.4 Bringing It All Together................................................................................. 119
5.3 Learning More* ................................................................................................... 119
5.4 Key Points ......................................................................................................... 119
6 Comparing Groups: Statistical Tests .................................................................................. 121
6.1 Data for Comparing Groups ...................................................................................... 121
6.2 Testing Group Frequencies: scipy.stats.chisquare()................................................ 122
6.3 Testing Observed Proportions: binom_test() ............................................................... 125
6.3.1 About Confidence Intervals ............................................................................. 126
6.3.2 More About binom_test() and Binomial Distributions........................................... 126
6.4 Testing Group Means: t Test...................................................................................... 127
6.5 Testing Multiple Group Means: Analysis of Variance (ANOVA)............................................... 130
6.5.1 A Brief Introduction to Formula Syntax................................................................ 130
6.5.2 ANOVA .................................................................................................. 130
6.5.3 Model Comparison in ANOVA*........................................................................ 132
6.5.4 Visualizing Group Confidence Intervals................................................................ 132
6.6 Learning More* ................................................................................................... 135
6.7 Key Points ......................................................................................................... 136
7 Identifying Drivers of Outcomes: Linear Models.................................................................... 137
7.1 Amusement Park Data ............................................................................................ 137
7.1.1 Simulating the Amusement Park Data.................................................................. 138
7.2 Fitting Linear Models with ols() .............................................................................. 140
7.2.1 Preliminary Data Inspection ............................................................................ 140
7.2.2 Recap: Bivariate Association ........................................................................... 141
7.2.3 Linear Model with a Single Predictor .................................................................. 143
7.2.4 ols Objects.............................................................................................. 145
7.2.5 Checking Model Fit ..................................................................................... 147
7.3 Fitting Linear Models with Multiple Predictors ................................................................. 152
7.3.1 Comparing Models ...................................................................................... 153
7.3.2 Using a Model to Make Predictions .................................................................... 155
7.3.3 Standardizing the Predictors ............................................................................ 156
7.4 Using Factors as Predictors ....................................................................................... 157
7.5 Interaction Terms.................................................................................................. 160
7.5.1 Language Brief: Advanced Formula Syntax* .......................................................... 162
7.5.2 Caution! Overfitting ..................................................................................... 162
7.5.3 Recommended Procedure for Linear Model Fitting ................................................... 163
7.6 Learning More* ................................................................................................... 164
7.7 Key Points ......................................................................................................... 164
8 Additional Linear Modeling Topics ................................................................................... 167
8.1 Handling Highly Correlated Variables ........................................................................... 167
8.1.1 An Initial Linear Model of Online Spend .............................................................. 167
8.1.2 Remediating Collinearity................................................................................ 170
8.2 Linear Models for Binary Outcomes: Logistic Regression...................................................... 173
8.2.1 Basics of the Logistic Regression Model............................................................... 173
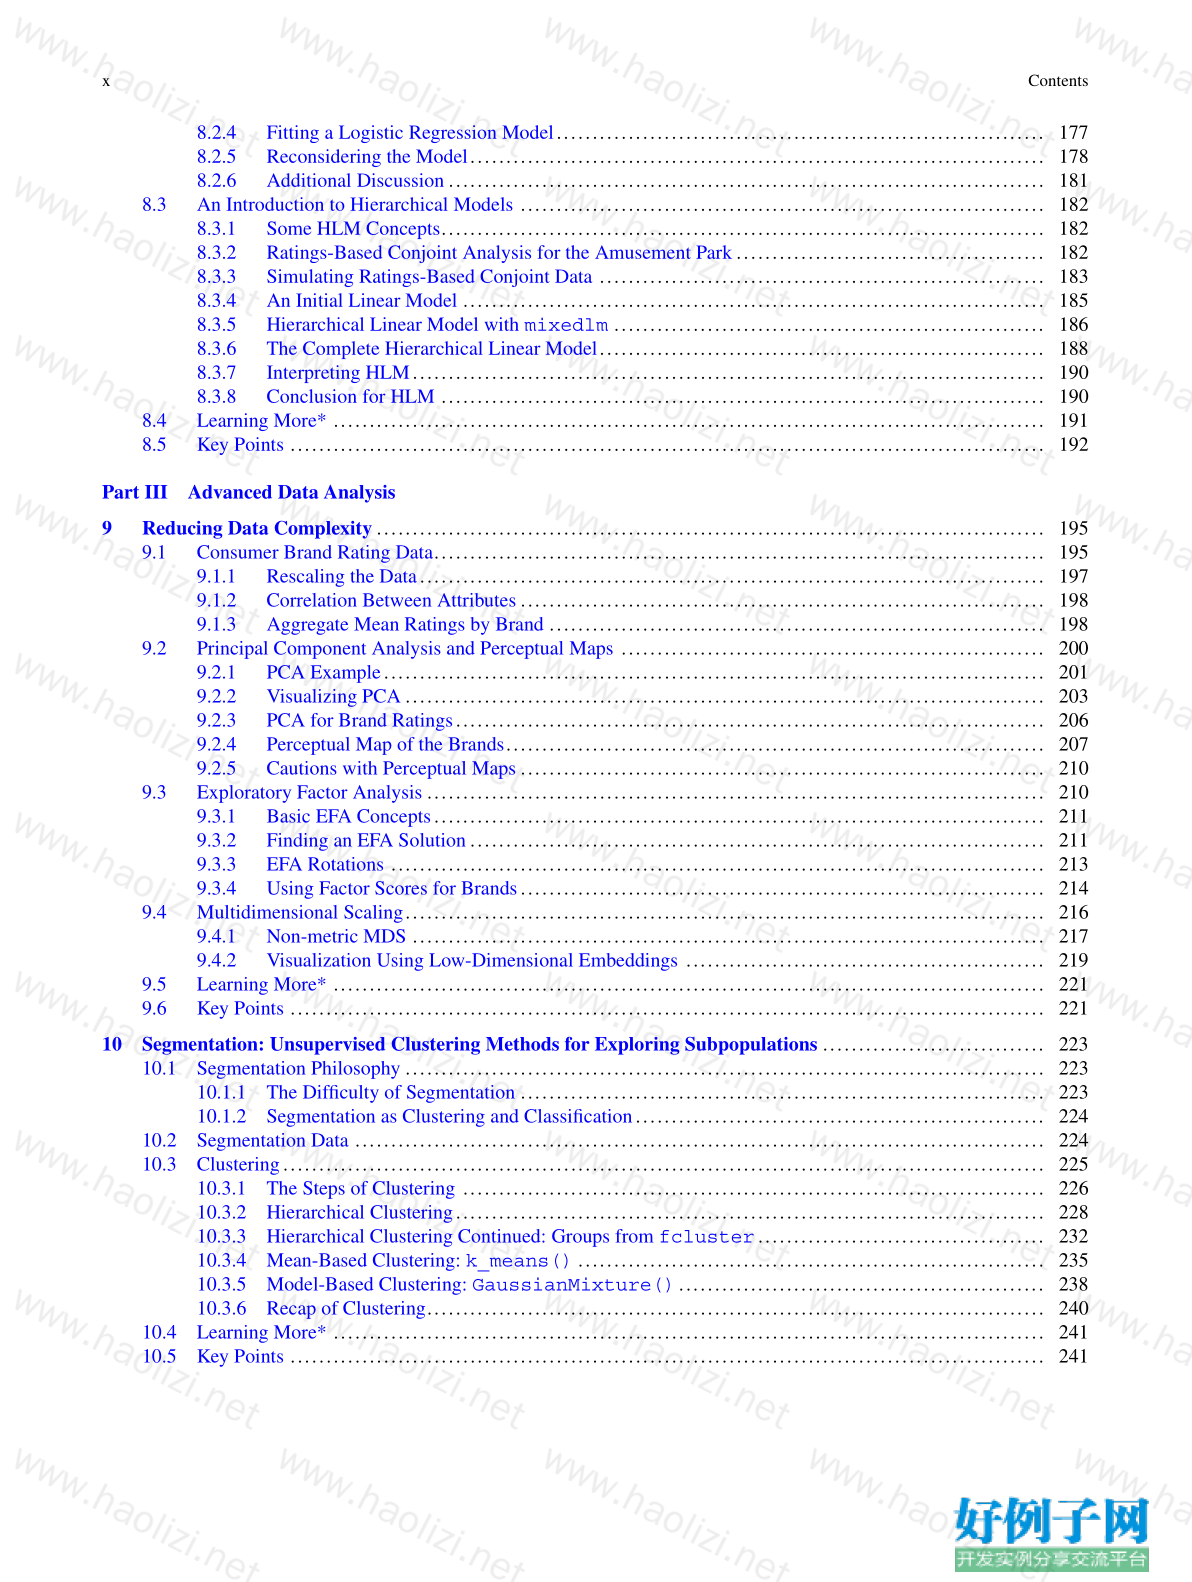
8.2.2 Data for Logistic Regression of Season Passes ........................................................ 174
8.2.3 Sales Table Data ......................................................................................... 175
x Contents
8.2.4 Fitting a Logistic Regression Model.................................................................... 177
8.2.5 Reconsidering the Model................................................................................ 178
8.2.6 Additional Discussion ................................................................................... 181
8.3 An Introduction to Hierarchical Models ......................................................................... 182
8.3.1 Some HLM Concepts.................................................................................... 182
8.3.2 Ratings-Based Conjoint Analysis for the Amusement Park ........................................... 182
8.3.3 Simulating Ratings-Based Conjoint Data .............................................................. 183
8.3.4 An Initial Linear Model ................................................................................. 185
8.3.5 Hierarchical Linear Model with mixedlm ............................................................ 186
8.3.6 The Complete Hierarchical Linear Model.............................................................. 188
8.3.7 Interpreting HLM........................................................................................ 190
8.3.8 Conclusion for HLM .................................................................................... 190
8.4 Learning More* ................................................................................................... 191
8.5 Key Points ......................................................................................................... 192
Part III Advanced Data Analysis
9 Reducing Data Complexity ............................................................................................. 195
9.1 Consumer Brand Rating Data..................................................................................... 195
9.1.1 Rescaling the Data....................................................................................... 197
9.1.2 Correlation Between Attributes ......................................................................... 198
9.1.3 Aggregate Mean Ratings by Brand ..................................................................... 198
9.2 Principal Component Analysis and Perceptual Maps ........................................................... 200
9.2.1 PCA Example............................................................................................ 201
9.2.2 Visualizing PCA ......................................................................................... 203
9.2.3 PCA for Brand Ratings.................................................................................. 206
9.2.4 Perceptual Map of the Brands........................................................................... 207
9.2.5 Cautions with Perceptual Maps ......................................................................... 210
9.3 Exploratory Factor Analysis ...................................................................................... 210
9.3.1 Basic EFA Concepts..................................................................................... 211
9.3.2 Finding an EFA Solution ................................................................................ 211
9.3.3 EFA Rotations ........................................................................................... 213
9.3.4 Using Factor Scores for Brands......................................................................... 214
9.4 Multidimensional Scaling......................................................................................... 216
9.4.1 Non-metric MDS ........................................................................................ 217
9.4.2 Visualization Using Low-Dimensional Embeddings .................................................. 219
9.5 Learning More* ................................................................................................... 221
9.6 Key Points ......................................................................................................... 221
10 Segmentation: Unsupervised Clustering Methods for Exploring Subpopulations ............................... 223
10.1 Segmentation Philosophy ......................................................................................... 223
10.1.1 The Difficulty of Segmentation ......................................................................... 223
10.1.2 Segmentation as Clustering and Classification......................................................... 224
10.2 Segmentation Data ................................................................................................ 224
10.3 Clustering.......................................................................................................... 225
10.3.1 The Steps of Clustering ................................................................................. 226
10.3.2 Hierarchical Clustering.................................................................................. 228
10.3.3 Hierarchical Clustering Continued: Groups from fcluster........................................ 232
10.3.4 Mean-Based Clustering: k_means() ................................................................. 235
10.3.5 Model-Based Clustering: GaussianMixture()................................................... 238
10.3.6 Recap of Clustering...................................................................................... 240
10.4 Learning More* ................................................................................................... 241
10.5 Key Points ......................................................................................................... 241
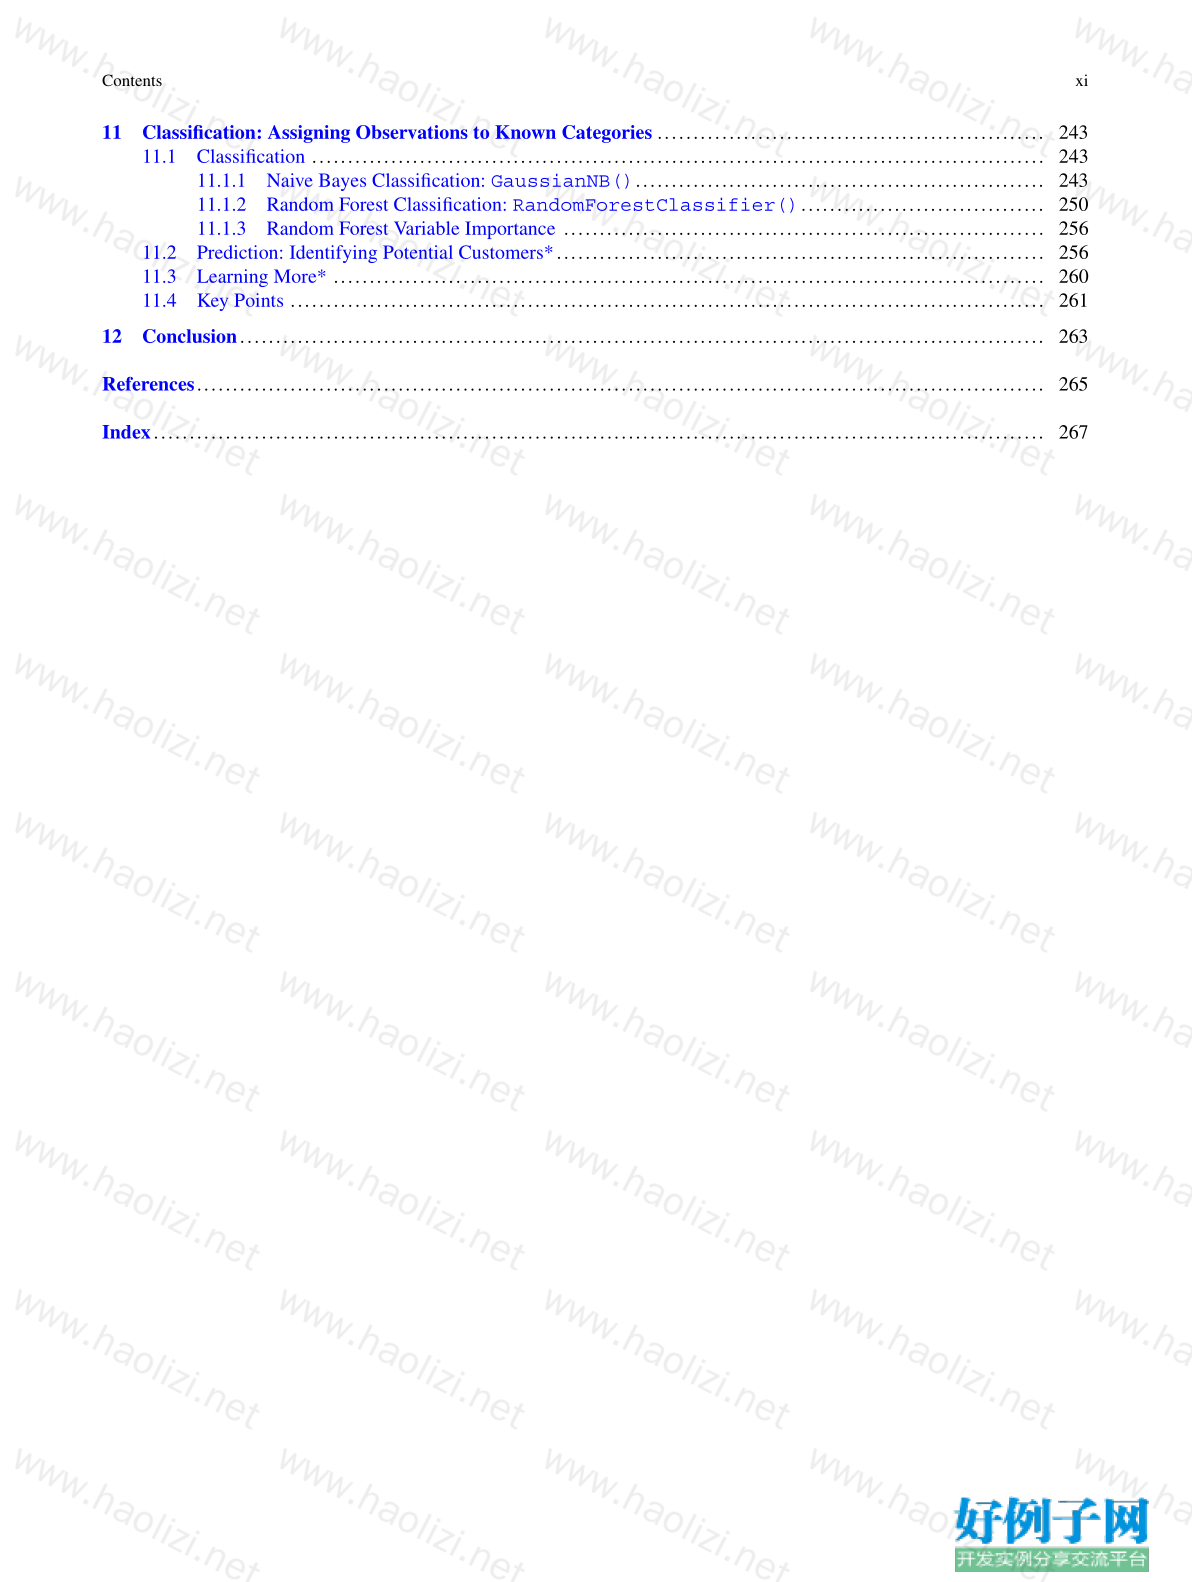
Contents xi
11 Classification: Assigning Observations to Known Categories ...................................................... 243
11.1 Classification ...................................................................................................... 243
11.1.1 Naive Bayes Classification: GaussianNB()......................................................... 243
11.1.2 Random Forest Classification: RandomForestClassifier().................................. 250
11.1.3 Random Forest Variable Importance ................................................................... 256
11.2 Prediction: Identifying Potential Customers*.................................................................... 256
11.3 Learning More* ................................................................................................... 260
11.4 Key Points ......................................................................................................... 261
12 Conclusion................................................................................................................ 263
References...................................................................................................................... 265
Index............................................................................................................................ 267
相关软件
小贴士
感谢您为本站写下的评论,您的评论对其它用户来说具有重要的参考价值,所以请认真填写。
- 类似“顶”、“沙发”之类没有营养的文字,对勤劳贡献的楼主来说是令人沮丧的反馈信息。
- 相信您也不想看到一排文字/表情墙,所以请不要反馈意义不大的重复字符,也请尽量不要纯表情的回复。
- 提问之前请再仔细看一遍楼主的说明,或许是您遗漏了。
- 请勿到处挖坑绊人、招贴广告。既占空间让人厌烦,又没人会搭理,于人于己都无利。
关于好例子网
本站旨在为广大IT学习爱好者提供一个非营利性互相学习交流分享平台。本站所有资源都可以被免费获取学习研究。本站资源来自网友分享,对搜索内容的合法性不具有预见性、识别性、控制性,仅供学习研究,请务必在下载后24小时内给予删除,不得用于其他任何用途,否则后果自负。基于互联网的特殊性,平台无法对用户传输的作品、信息、内容的权属或合法性、安全性、合规性、真实性、科学性、完整权、有效性等进行实质审查;无论平台是否已进行审查,用户均应自行承担因其传输的作品、信息、内容而可能或已经产生的侵权或权属纠纷等法律责任。本站所有资源不代表本站的观点或立场,基于网友分享,根据中国法律《信息网络传播权保护条例》第二十二与二十三条之规定,若资源存在侵权或相关问题请联系本站客服人员,点此联系我们。关于更多版权及免责申明参见 版权及免责申明


网友评论
我要评论