实例介绍
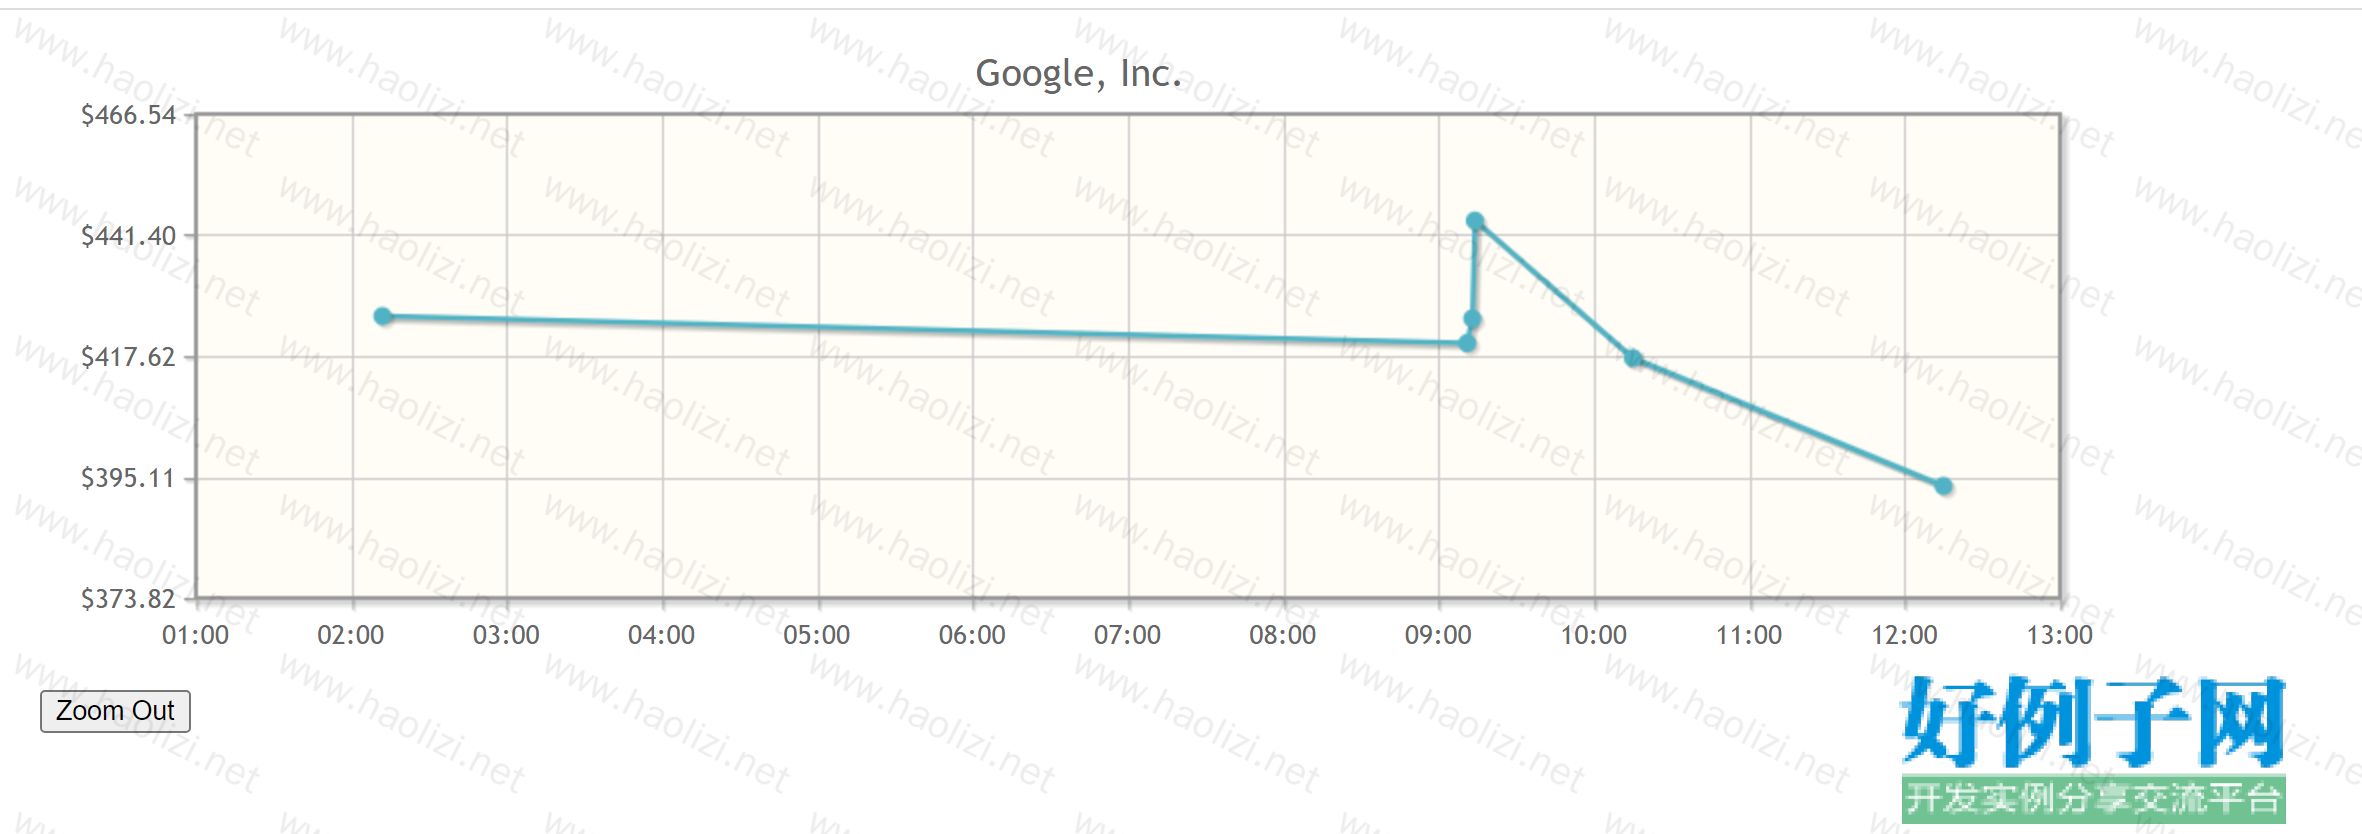
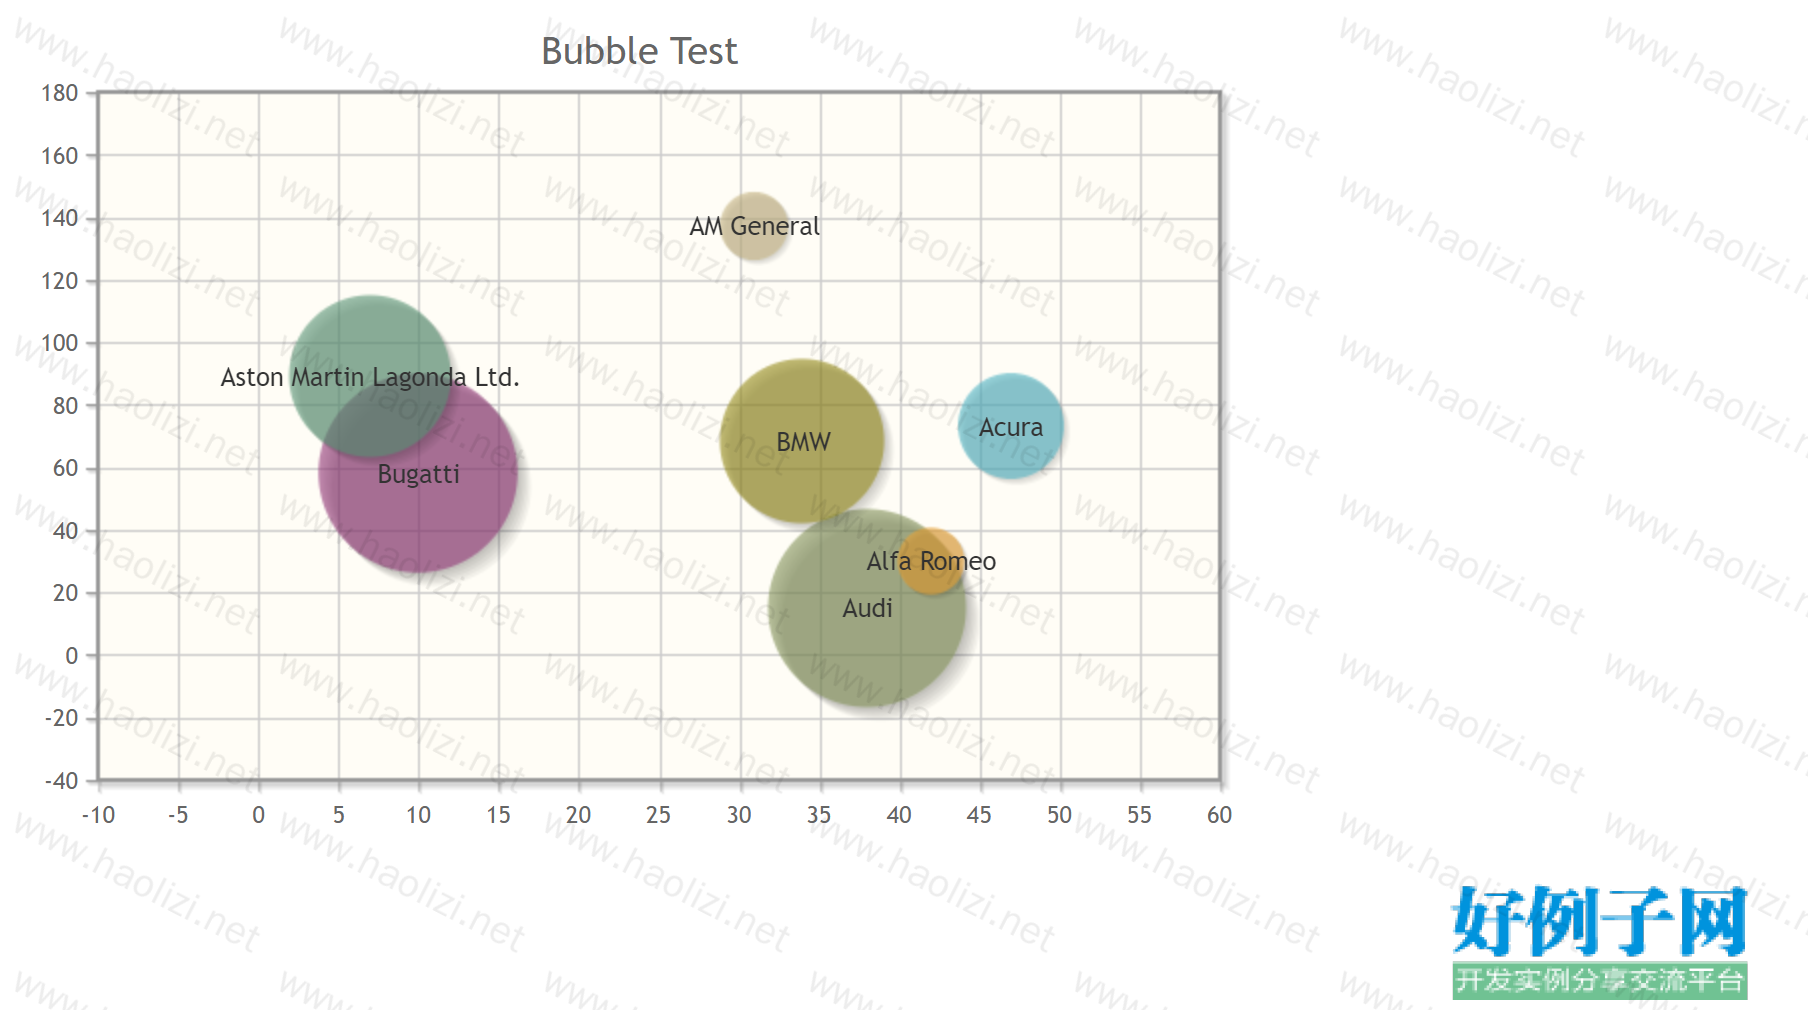
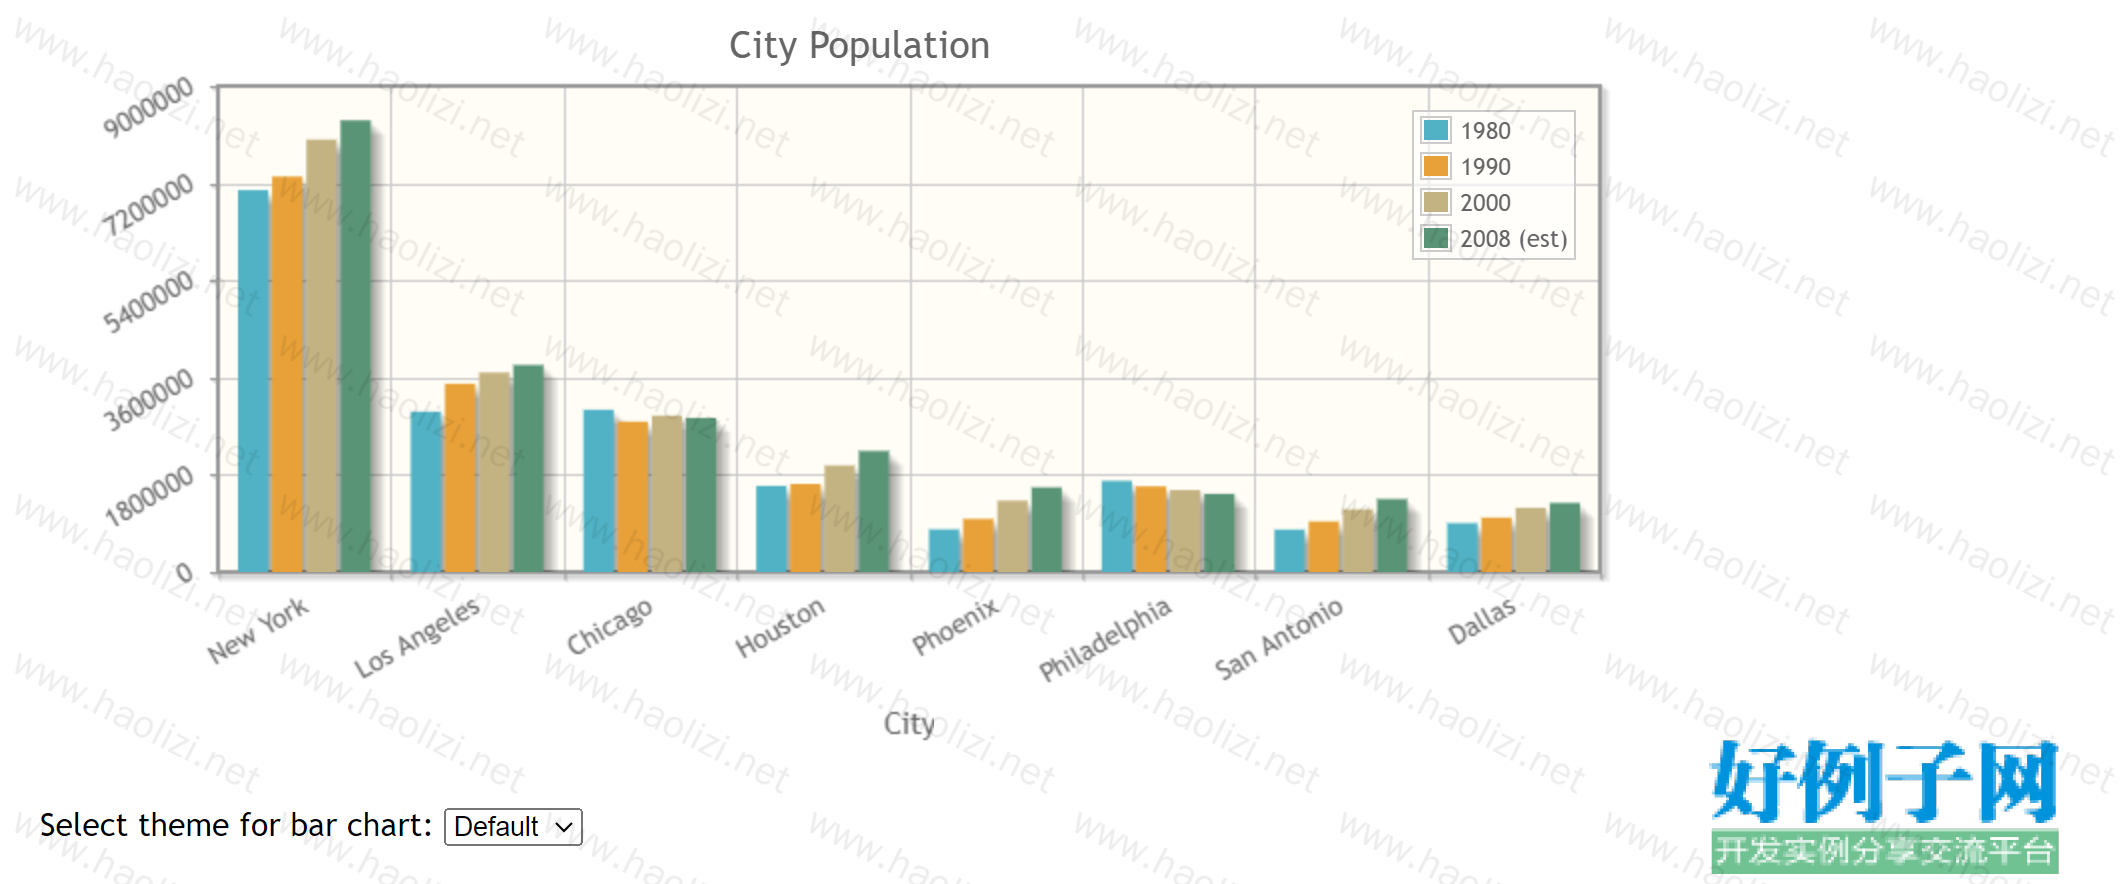
【实例简介】柱形图,饼图,线形图,很全
最新php柱形图,饼图,线形图,很全~最新php柱形图,饼图,线形图,很全~【实例截图】
【核心代码】
.
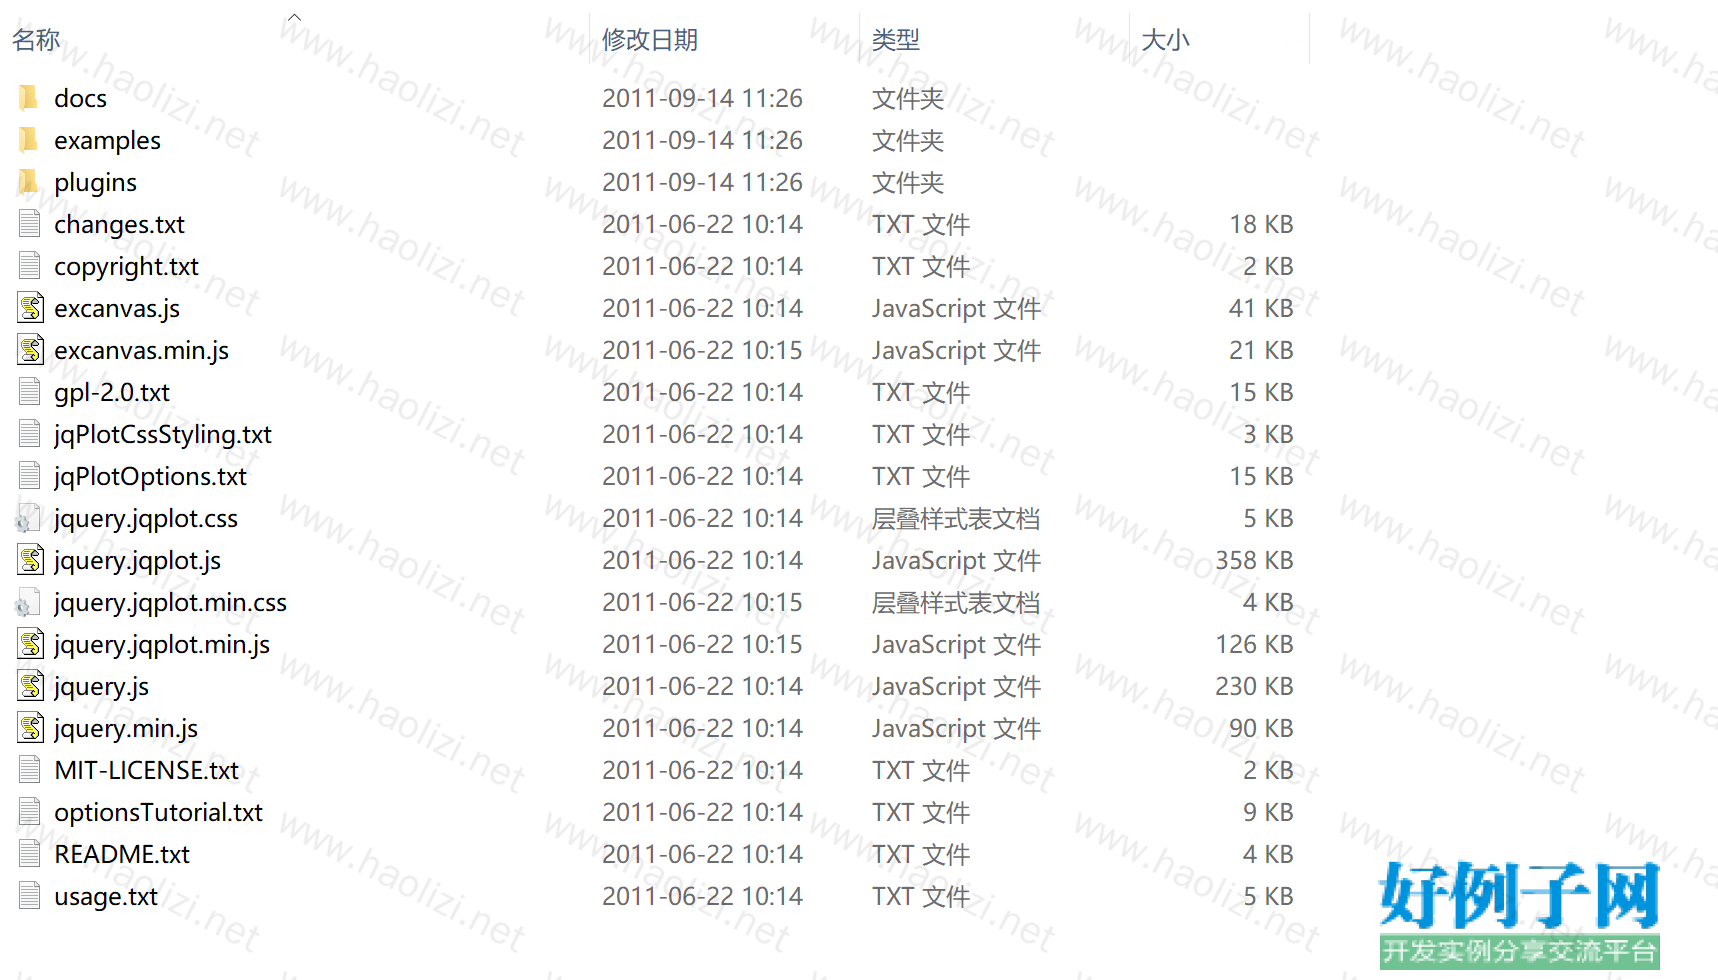
├── dist
│ ├── MIT-LICENSE.txt
│ ├── README.txt
│ ├── changes.txt
│ ├── copyright.txt
│ ├── docs
│ │ ├── files
│ │ │ ├── MIT-LICENSE-txt.html
│ │ │ ├── changes-txt.html
│ │ │ ├── gpl-2-0-txt.html
│ │ │ ├── images
│ │ │ │ ├── background.jpg
│ │ │ │ ├── basicline.png
│ │ │ │ ├── basiclogaxis.png
│ │ │ │ ├── basiclogoptions.png
│ │ │ │ ├── basicoptions.png
│ │ │ │ ├── dualaxis.png
│ │ │ │ ├── logo.jpg
│ │ │ │ ├── navdocs.png
│ │ │ │ ├── navdocsover.png
│ │ │ │ ├── navdownload.png
│ │ │ │ ├── navdownloadover.png
│ │ │ │ ├── navexamples.png
│ │ │ │ ├── navexamplesover.png
│ │ │ │ ├── navhome.png
│ │ │ │ ├── navhomeover.png
│ │ │ │ ├── new.png
│ │ │ │ ├── sample3.png
│ │ │ │ └── samplesm.png
│ │ │ ├── jqPlotCssStyling-txt.html
│ │ │ ├── jqPlotOptions-txt.html
│ │ │ ├── jqplot-axisLabelRenderer-js.html
│ │ │ ├── jqplot-axisTickRenderer-js.html
│ │ │ ├── jqplot-canvasGridRenderer-js.html
│ │ │ ├── jqplot-core-js.html
│ │ │ ├── jqplot-divTitleRenderer-js.html
│ │ │ ├── jqplot-lineRenderer-js.html
│ │ │ ├── jqplot-linearAxisRenderer-js.html
│ │ │ ├── jqplot-markerRenderer-js.html
│ │ │ ├── jqplot-shadowRenderer-js.html
│ │ │ ├── jqplot-shapeRenderer-js.html
│ │ │ ├── jqplot-themeEngine-js.html
│ │ │ ├── optionsTutorial-txt.html
│ │ │ ├── plugins
│ │ │ │ ├── jqplot-BezierCurveRenderer-js.html
│ │ │ │ ├── jqplot-barRenderer-js.html
│ │ │ │ ├── jqplot-blockRenderer-js.html
│ │ │ │ ├── jqplot-bubbleRenderer-js.html
│ │ │ │ ├── jqplot-canvasAxisLabelRenderer-js.html
│ │ │ │ ├── jqplot-canvasAxisTickRenderer-js.html
│ │ │ │ ├── jqplot-canvasOverlay-js.html
│ │ │ │ ├── jqplot-categoryAxisRenderer-js.html
│ │ │ │ ├── jqplot-ciParser-js.html
│ │ │ │ ├── jqplot-cursor-js.html
│ │ │ │ ├── jqplot-dateAxisRenderer-js.html
│ │ │ │ ├── jqplot-donutRenderer-js.html
│ │ │ │ ├── jqplot-dragable-js.html
│ │ │ │ ├── jqplot-enhancedLegendRenderer-js.html
│ │ │ │ ├── jqplot-funnelRenderer-js.html
│ │ │ │ ├── jqplot-highlighter-js.html
│ │ │ │ ├── jqplot-logAxisRenderer-js.html
│ │ │ │ ├── jqplot-mekkoAxisRenderer-js.html
│ │ │ │ ├── jqplot-mekkoRenderer-js.html
│ │ │ │ ├── jqplot-meterGaugeRenderer-js.html
│ │ │ │ ├── jqplot-ohlcRenderer-js.html
│ │ │ │ ├── jqplot-pieRenderer-js.html
│ │ │ │ ├── jqplot-pointLabels-js.html
│ │ │ │ └── jqplot-trendline-js.html
│ │ │ └── usage-txt.html
│ │ ├── index
│ │ │ ├── Classes.html
│ │ │ ├── Files.html
│ │ │ ├── Functions.html
│ │ │ ├── General.html
│ │ │ ├── General2.html
│ │ │ ├── General3.html
│ │ │ ├── General4.html
│ │ │ ├── General5.html
│ │ │ ├── General6.html
│ │ │ ├── Hooks.html
│ │ │ ├── Properties.html
│ │ │ ├── Properties2.html
│ │ │ ├── Properties3.html
│ │ │ ├── Properties4.html
│ │ │ └── Properties5.html
│ │ ├── index.html
│ │ ├── javascript
│ │ │ ├── main.js
│ │ │ └── searchdata.js
│ │ ├── search
│ │ │ ├── ClassesA.html
│ │ │ ├── ClassesD.html
│ │ │ ├── ClassesG.html
│ │ │ ├── ClassesH.html
│ │ │ ├── ClassesJ.html
│ │ │ ├── ClassesL.html
│ │ │ ├── ClassesS.html
│ │ │ ├── ClassesSymbols.html
│ │ │ ├── ClassesT.html
│ │ │ ├── ClassesV.html
│ │ │ ├── FilesJ.html
│ │ │ ├── FunctionsC.html
│ │ │ ├── FunctionsD.html
│ │ │ ├── FunctionsG.html
│ │ │ ├── FunctionsI.html
│ │ │ ├── FunctionsM.html
│ │ │ ├── FunctionsN.html
│ │ │ ├── FunctionsR.html
│ │ │ ├── FunctionsS.html
│ │ │ ├── FunctionsZ.html
│ │ │ ├── GeneralA.html
│ │ │ ├── GeneralB.html
│ │ │ ├── GeneralC.html
│ │ │ ├── GeneralD.html
│ │ │ ├── GeneralE.html
│ │ │ ├── GeneralF.html
│ │ │ ├── GeneralG.html
│ │ │ ├── GeneralH.html
│ │ │ ├── GeneralI.html
│ │ │ ├── GeneralJ.html
│ │ │ ├── GeneralL.html
│ │ │ ├── GeneralM.html
│ │ │ ├── GeneralN.html
│ │ │ ├── GeneralO.html
│ │ │ ├── GeneralP.html
│ │ │ ├── GeneralR.html
│ │ │ ├── GeneralS.html
│ │ │ ├── GeneralSymbols.html
│ │ │ ├── GeneralT.html
│ │ │ ├── GeneralU.html
│ │ │ ├── GeneralV.html
│ │ │ ├── GeneralW.html
│ │ │ ├── GeneralX.html
│ │ │ ├── GeneralY.html
│ │ │ ├── GeneralZ.html
│ │ │ ├── HooksA.html
│ │ │ ├── HooksE.html
│ │ │ ├── HooksJ.html
│ │ │ ├── HooksP.html
│ │ │ ├── NoResults.html
│ │ │ ├── PropertiesA.html
│ │ │ ├── PropertiesB.html
│ │ │ ├── PropertiesC.html
│ │ │ ├── PropertiesD.html
│ │ │ ├── PropertiesE.html
│ │ │ ├── PropertiesF.html
│ │ │ ├── PropertiesG.html
│ │ │ ├── PropertiesH.html
│ │ │ ├── PropertiesI.html
│ │ │ ├── PropertiesL.html
│ │ │ ├── PropertiesM.html
│ │ │ ├── PropertiesN.html
│ │ │ ├── PropertiesO.html
│ │ │ ├── PropertiesP.html
│ │ │ ├── PropertiesR.html
│ │ │ ├── PropertiesS.html
│ │ │ ├── PropertiesT.html
│ │ │ ├── PropertiesU.html
│ │ │ ├── PropertiesV.html
│ │ │ ├── PropertiesW.html
│ │ │ ├── PropertiesX.html
│ │ │ ├── PropertiesY.html
│ │ │ └── PropertiesZ.html
│ │ └── styles
│ │ ├── 1.css
│ │ ├── 2.css
│ │ └── main.css
│ ├── examples
│ │ ├── OHLC.html
│ │ ├── OHLC2.html
│ │ ├── ajax-loader.gif
│ │ ├── area.html
│ │ ├── axisLabel.html
│ │ ├── axisLabelsRotatedText.html
│ │ ├── axisLabelsRotatedText2.html
│ │ ├── axisScalingForceTicAt.html
│ │ ├── barLinePieStack.html
│ │ ├── barMissingValues.html
│ │ ├── barTest.html
│ │ ├── barTest2.html
│ │ ├── bezierCurve.html
│ │ ├── blockPlot.html
│ │ ├── breakOnNull.html
│ │ ├── bubbleChart2.html
│ │ ├── bubblechart.html
│ │ ├── candlestickCanvasOverlay.html
│ │ ├── canvasOverlay.html
│ │ ├── catchError.html
│ │ ├── categoryHorizontalBar.html
│ │ ├── categoryVsLinearAxes.html
│ │ ├── chartInTable.html
│ │ ├── ciParser.html
│ │ ├── customHighlighterCursorTrendline.html
│ │ ├── customPieTests.html
│ │ ├── dataLabels.html
│ │ ├── dataRenderer.html
│ │ ├── dataTracking.html
│ │ ├── donutTest.html
│ │ ├── donutTest.js
│ │ ├── donutTest2.html
│ │ ├── dynamicplot.html
│ │ ├── example.js
│ │ ├── examples.css
│ │ ├── fillToZero.html
│ │ ├── filledLine.html
│ │ ├── filledLineCategoryAxis.html
│ │ ├── funnelTest.html
│ │ ├── funnelTest.js
│ │ ├── gridCustomization.html
│ │ ├── gridPadding.html
│ │ ├── hiddenPlot.html
│ │ ├── highlighter.html
│ │ ├── highlighter2.html
│ │ ├── highlighter3.html
│ │ ├── horizontalLine.html
│ │ ├── intticks.html
│ │ ├── jquery-ui
│ │ │ ├── css
│ │ │ │ └── ui-lightness
│ │ │ │ ├── images
│ │ │ │ │ ├── ui-bg_diagonals-thick_18_b81900_40x40.png
│ │ │ │ │ ├── ui-bg_diagonals-thick_20_666666_40x40.png
│ │ │ │ │ ├── ui-bg_flat_10_000000_40x100.png
│ │ │ │ │ ├── ui-bg_glass_100_f6f6f6_1x400.png
│ │ │ │ │ ├── ui-bg_glass_100_fdf5ce_1x400.png
│ │ │ │ │ ├── ui-bg_glass_65_ffffff_1x400.png
│ │ │ │ │ ├── ui-bg_gloss-wave_35_f6a828_500x100.png
│ │ │ │ │ ├── ui-bg_highlight-soft_100_eeeeee_1x100.png
│ │ │ │ │ ├── ui-bg_highlight-soft_75_ffe45c_1x100.png
│ │ │ │ │ ├── ui-icons_222222_256x240.png
│ │ │ │ │ ├── ui-icons_228ef1_256x240.png
│ │ │ │ │ ├── ui-icons_ef8c08_256x240.png
│ │ │ │ │ ├── ui-icons_ffd27a_256x240.png
│ │ │ │ │ └── ui-icons_ffffff_256x240.png
│ │ │ │ └── jquery-ui-1.8.6.custom.css
│ │ │ └── js
│ │ │ ├── jquery-ui-1.8.1.custom.min.js
│ │ │ └── jquery-ui-1.8.6.custom.min.js
│ │ ├── jsondata.txt
│ │ ├── legendLabels.html
│ │ ├── legendLabels2.html
│ │ ├── linepiebar.html
│ │ ├── markerStyles.html
│ │ ├── mekkoChart.html
│ │ ├── meterGauge.html
│ │ ├── meterGauge2.html
│ │ ├── minMaxLines.html
│ │ ├── missingValues.html
│ │ ├── multiAxesRotatedText.html
│ │ ├── multipleBarColors.html
│ │ ├── multipleLines.html
│ │ ├── multipleYAxes.html
│ │ ├── nav.inc
│ │ ├── noDataOptions.html
│ │ ├── pieTest.html
│ │ ├── pieTest2.html
│ │ ├── pieTest2.js
│ │ ├── pieTest3.html
│ │ ├── pieTest4.html
│ │ ├── pointLabels.html
│ │ ├── pointLabels2.html
│ │ ├── prefix.html
│ │ ├── resetAxisTicks.html
│ │ ├── resizablePlot.html
│ │ ├── resizablePlot2.html
│ │ ├── rotatedTickLabels.html
│ │ ├── rotatedTickLabelsZoom.html
│ │ ├── seriesCanvasReorder.html
│ │ ├── seriesUpdate.html
│ │ ├── shadowTests.html
│ │ ├── singlePoint.html
│ │ ├── sparkLine.html
│ │ ├── stackedBar2.html
│ │ ├── stackedBar3.html
│ │ ├── stackedBarCategoryVsLinearAxes.html
│ │ ├── stackedCategoryAxis.html
│ │ ├── stackedFilledLine.html
│ │ ├── stackedLine.html
│ │ ├── test2.html
│ │ ├── theming.html
│ │ ├── trendlineDragableCustomization.html
│ │ ├── ui.html
│ │ ├── verticalLine.html
│ │ ├── waterfall.html
│ │ ├── waterfall2.html
│ │ ├── zoom1.html
│ │ ├── zoom2.html
│ │ ├── zoom3.html
│ │ ├── zoom4.html
│ │ ├── zoomOptions.html
│ │ └── zoomProxy.html
│ ├── excanvas.js
│ ├── excanvas.min.js
│ ├── gpl-2.0.txt
│ ├── jqPlotCssStyling.txt
│ ├── jqPlotOptions.txt
│ ├── jquery.jqplot.css
│ ├── jquery.jqplot.js
│ ├── jquery.jqplot.min.css
│ ├── jquery.jqplot.min.js
│ ├── jquery.js
│ ├── jquery.min.js
│ ├── optionsTutorial.txt
│ ├── plugins
│ │ ├── jqplot.BezierCurveRenderer.js
│ │ ├── jqplot.BezierCurveRenderer.min.js
│ │ ├── jqplot.barRenderer.js
│ │ ├── jqplot.barRenderer.min.js
│ │ ├── jqplot.blockRenderer.js
│ │ ├── jqplot.blockRenderer.min.js
│ │ ├── jqplot.bubbleRenderer.js
│ │ ├── jqplot.bubbleRenderer.min.js
│ │ ├── jqplot.canvasAxisLabelRenderer.js
│ │ ├── jqplot.canvasAxisLabelRenderer.min.js
│ │ ├── jqplot.canvasAxisTickRenderer.js
│ │ ├── jqplot.canvasAxisTickRenderer.min.js
│ │ ├── jqplot.canvasOverlay.js
│ │ ├── jqplot.canvasOverlay.min.js
│ │ ├── jqplot.canvasTextRenderer.js
│ │ ├── jqplot.canvasTextRenderer.min.js
│ │ ├── jqplot.categoryAxisRenderer.js
│ │ ├── jqplot.categoryAxisRenderer.min.js
│ │ ├── jqplot.ciParser.js
│ │ ├── jqplot.ciParser.min.js
│ │ ├── jqplot.cursor.js
│ │ ├── jqplot.cursor.min.js
│ │ ├── jqplot.dateAxisRenderer.js
│ │ ├── jqplot.dateAxisRenderer.min.js
│ │ ├── jqplot.donutRenderer.js
│ │ ├── jqplot.donutRenderer.min.js
│ │ ├── jqplot.dragable.js
│ │ ├── jqplot.dragable.min.js
│ │ ├── jqplot.enhancedLegendRenderer.js
│ │ ├── jqplot.enhancedLegendRenderer.min.js
│ │ ├── jqplot.funnelRenderer.js
│ │ ├── jqplot.funnelRenderer.min.js
│ │ ├── jqplot.highlighter.js
│ │ ├── jqplot.highlighter.min.js
│ │ ├── jqplot.json2.js
│ │ ├── jqplot.json2.min.js
│ │ ├── jqplot.logAxisRenderer.js
│ │ ├── jqplot.logAxisRenderer.min.js
│ │ ├── jqplot.mekkoAxisRenderer.js
│ │ ├── jqplot.mekkoAxisRenderer.min.js
│ │ ├── jqplot.mekkoRenderer.js
│ │ ├── jqplot.mekkoRenderer.min.js
│ │ ├── jqplot.meterGaugeRenderer.js
│ │ ├── jqplot.meterGaugeRenderer.min.js
│ │ ├── jqplot.ohlcRenderer.js
│ │ ├── jqplot.ohlcRenderer.min.js
│ │ ├── jqplot.pieRenderer.js
│ │ ├── jqplot.pieRenderer.min.js
│ │ ├── jqplot.pointLabels.js
│ │ ├── jqplot.pointLabels.min.js
│ │ ├── jqplot.trendline.js
│ │ └── jqplot.trendline.min.js
│ └── usage.txt
└── 最新php柱形图,饼图,线形图,很全.rar
16 directories, 342 files
小贴士
感谢您为本站写下的评论,您的评论对其它用户来说具有重要的参考价值,所以请认真填写。
- 类似“顶”、“沙发”之类没有营养的文字,对勤劳贡献的楼主来说是令人沮丧的反馈信息。
- 相信您也不想看到一排文字/表情墙,所以请不要反馈意义不大的重复字符,也请尽量不要纯表情的回复。
- 提问之前请再仔细看一遍楼主的说明,或许是您遗漏了。
- 请勿到处挖坑绊人、招贴广告。既占空间让人厌烦,又没人会搭理,于人于己都无利。
关于好例子网
本站旨在为广大IT学习爱好者提供一个非营利性互相学习交流分享平台。本站所有资源都可以被免费获取学习研究。本站资源来自网友分享,对搜索内容的合法性不具有预见性、识别性、控制性,仅供学习研究,请务必在下载后24小时内给予删除,不得用于其他任何用途,否则后果自负。基于互联网的特殊性,平台无法对用户传输的作品、信息、内容的权属或合法性、安全性、合规性、真实性、科学性、完整权、有效性等进行实质审查;无论平台是否已进行审查,用户均应自行承担因其传输的作品、信息、内容而可能或已经产生的侵权或权属纠纷等法律责任。本站所有资源不代表本站的观点或立场,基于网友分享,根据中国法律《信息网络传播权保护条例》第二十二与二十三条之规定,若资源存在侵权或相关问题请联系本站客服人员,点此联系我们。关于更多版权及免责申明参见 版权及免责申明



网友评论
我要评论