
实例介绍
【实例简介】使用jquery.jsPlumb实现简单流程图绘制
【实例截图】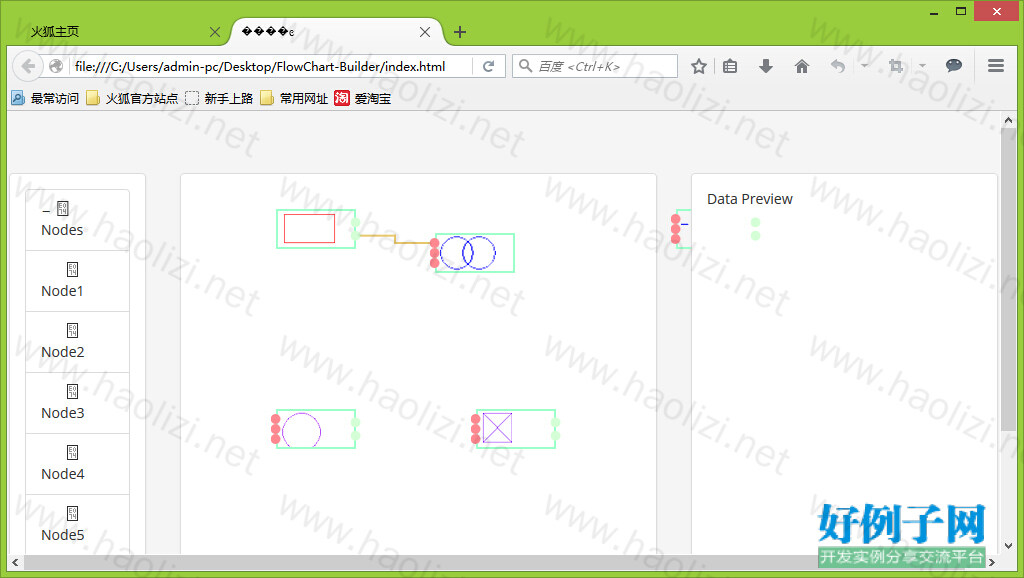
【核心代码】
function addNode(parentId, nodeId, nodeLable, position) {
var panel = d3.select("#" parentId);
panel.append('div').style('width','auto').style('height','auto')
.style('position','absolute')
.style('top',position.y).style('left',position.x)
.style('border','2px #9DFFCA solid').attr('align','center')
.attr('id',nodeId).classed('node',true)
.text(nodeLable);
return jsPlumb.getSelector('#' nodeId)[0];
}
function addPorts(instance, node, ports, type) {
//Assume horizental layout
var number_of_ports = ports.length;
var i = 0;
var height = $(node).height(); //Note, jquery does not include border for height
var y_offset = 1 / ( number_of_ports 1);
var y = 0;
for ( ; i < number_of_ports; i ) {
var anchor = [0,0,0,0];
var paintStyle = { radius:5, fillStyle:'#FF8891' };
var isSource = false, isTarget = false;
if ( type === 'output' ) {
anchor[0] = 1;
paintStyle.fillStyle = '#D4FFD6';
isSource = true;
} else {
isTarget =true;
}
anchor[1] = y y_offset;
y = anchor[1];
instance.addEndpoint(node, {
uuid:node.getAttribute("id") "-" ports[i],
paintStyle: paintStyle,
anchor:anchor,
maxConnections:-1,
isSource:isSource,
isTarget:isTarget
});
}
}
function connectPorts(instance, node1, port1, node2 , port2) {
// declare some common values:
var color = "gray";
var arrowCommon = { foldback:0.8, fillStyle:color, width:5 },
// use three-arg spec to create two different arrows with the common values:
overlays = [
[ "Arrow", { location:0.8 }, arrowCommon ],
[ "Arrow", { location:0.2, direction:-1 }, arrowCommon ]
];
var uuid_source = node1.getAttribute("id") "-" port1;
var uuid_target = node2.getAttribute("id") "-" port2;
instance.connect({uuids:[uuid_source, uuid_target]});
}
function getTreeData() {
var tree = [
{
text: "Nodes",
nodes: [
{
text: "Node1",
},
{
text: "Node2"
},
{
text: "Node3"
},
{
text: "Node4"
},
{
text: "Node5"
},
{
text: "Node6"
}
]
}
];
return tree;
}
jsPlumb.ready(function() {
var color = "#E8C870";
var instance = jsPlumb.getInstance({
Connector: ["Flowchart", { curviness: 50 }],//Flowchart折线、Straight直线、Bezier贝塞尔曲线
DragOptions : { cursor: "pointer", zIndex:2000 },
PaintStyle : { strokeStyle:color, lineWidth:2 },
EndpointStyle : { radius:5, fillStyle:color },
HoverPaintStyle : {strokeStyle:"#7073EB" },
EndpointHoverStyle : {fillStyle:"#7073EB" },
Container:"Diagrampanel"
});
$('#control-panel').treeview({data: getTreeData()});
$('.list-group-item').attr('draggable','true').on('dragstart', function(ev){
ev.originalEvent.dataTransfer.setData('text',ev.target.textContent);
});
$('#Diagrampanel').on('drop', function(ev){
if (ev.target.className.indexOf('_jsPlumb') >= 0 ) {
return;
}
ev.preventDefault();
var mx = '' ev.originalEvent.offsetX 'px';
var my = '' ev.originalEvent.offsetY 'px';
var uid = new Date().getTime();
var node = addNode('Diagrampanel','node' uid, 'node', {x:mx,y:my});
addPorts(instance, node, ['out'],'output');
addPorts(instance, node, ['in1','in2'],'input');
instance.draggable($(node));
}).on('dragover', function(ev){
ev.preventDefault();
console.log('on drag over');
});
instance.doWhileSuspended(function() {
var arrowCommon = { foldback:0.8, fillStyle:color, width:5 },
overlays = [
[ "Arrow", { location:0.8 }, arrowCommon ],
[ "Arrow", { location:0.2, direction:-1 }, arrowCommon ]
];
var node1 = addNode('Diagrampanel', 'node1', "<img src='sbimage/BDZ.png' />", { x: '80px', y: '20px' });
node1.style.backgroundImage = "url(sbimage/BDZ.png)";
node1.style.backgroundRepeat = "no-repeat";
var node2 = addNode('Diagrampanel', 'node2', "<img src='sbimage/BG.png' />", { x: '280px', y: '20px' });
node2.style.backgroundImage = "url(sbimage/BG.png)";
node2.style.backgroundRepeat = "no-repeat";
var node3 = addNode('Diagrampanel', 'node3',"<img src='sbimage/DL.png' />", { x: '480px', y: '20px' });
node3.style.backgroundImage = "url(sbimage/DL.png)";
node3.style.backgroundRepeat = "no-repeat";
var node4 = addNode('Diagrampanel', 'node4',"<img src='sbimage/SNG.png' />", { x: '80px', y: '220px' });
node4.style.backgroundImage = "url(sbimage/SNG.png)";
node4.style.backgroundRepeat = "no-repeat";
var node5 = addNode('Diagrampanel', 'node5', "<img src='sbimage/TT.png' />", { x: '280px', y: '220px' });
node5.style.backgroundImage = "url(sbimage/TT.png)";
node5.style.backgroundRepeat = "no-repeat";
addPorts(instance, node1, ['out1','out2'],'output');
addPorts(instance, node2, ['in', 'in1', 'in2'], 'input');
addPorts(instance, node3, ['out1', 'out2'], 'output');
addPorts(instance, node3, ['in', 'in1', 'in2'], 'input');
addPorts(instance, node4, ['out1', 'out2'], 'output');
addPorts(instance, node4, ['in', 'in1', 'in2'], 'input');
addPorts(instance, node5, ['out1', 'out2'], 'output');
addPorts(instance, node5, ['in', 'in1', 'in2'], 'input');
connectPorts(instance, node1, 'out2', node2, 'in');
instance.draggable($('.node'));
});
jsPlumb.fire("jsFlowLoaded", instance);
});
标签: JavaScript绘制 流程图
相关软件
小贴士
感谢您为本站写下的评论,您的评论对其它用户来说具有重要的参考价值,所以请认真填写。
- 类似“顶”、“沙发”之类没有营养的文字,对勤劳贡献的楼主来说是令人沮丧的反馈信息。
- 相信您也不想看到一排文字/表情墙,所以请不要反馈意义不大的重复字符,也请尽量不要纯表情的回复。
- 提问之前请再仔细看一遍楼主的说明,或许是您遗漏了。
- 请勿到处挖坑绊人、招贴广告。既占空间让人厌烦,又没人会搭理,于人于己都无利。
关于好例子网
本站旨在为广大IT学习爱好者提供一个非营利性互相学习交流分享平台。本站所有资源都可以被免费获取学习研究。本站资源来自网友分享,对搜索内容的合法性不具有预见性、识别性、控制性,仅供学习研究,请务必在下载后24小时内给予删除,不得用于其他任何用途,否则后果自负。基于互联网的特殊性,平台无法对用户传输的作品、信息、内容的权属或合法性、安全性、合规性、真实性、科学性、完整权、有效性等进行实质审查;无论平台是否已进行审查,用户均应自行承担因其传输的作品、信息、内容而可能或已经产生的侵权或权属纠纷等法律责任。本站所有资源不代表本站的观点或立场,基于网友分享,根据中国法律《信息网络传播权保护条例》第二十二与二十三条之规定,若资源存在侵权或相关问题请联系本站客服人员,点此联系我们。关于更多版权及免责申明参见 版权及免责申明

网友评论
我要评论