
实例介绍
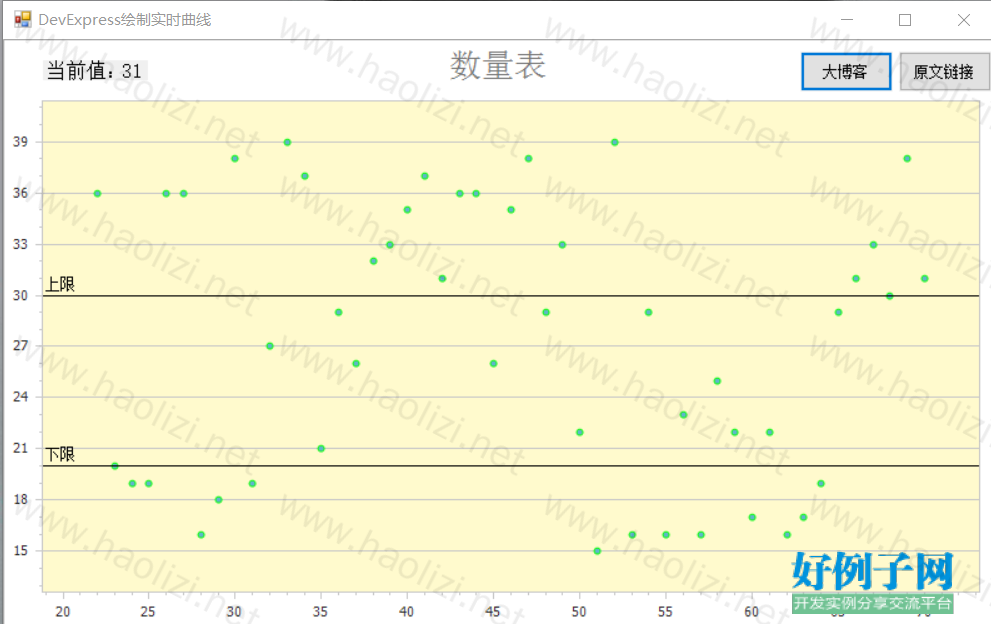
【实例简介】这篇文章(https://www.daboke.com)主要介绍了如何使用DevExpress的ChartControl控件绘制酷炫的实时的曲线
【实例截图】
【核心代码】
using System;
using System.Collections.Generic;
using System.ComponentModel;
using System.Data;
using System.Drawing;
using System.Linq;
using System.Text;
using System.Threading.Tasks;
using System.Windows.Forms;
using DevExpress.XtraCharts;
using System.Timers;

namespace lianxi3
{
    public partial class Form1 : Form
    {
        public Form1()
        {
            InitializeComponent();
        }
        int row = 0;//点数
        int value = 0;//数值
        Random rd = new Random();//随机值

        // 创建一个点图
        ChartControl pointChart = new ChartControl();
        // 创建一条曲线
        Series series1 = new Series("Series 1", ViewType.Point);

        private void addPoint(object source, System.Timers.ElapsedEventArgs e)
        {
            row = row   1;//点数自增
            value = rd.Next(15, 40);//生成随机值

            //点数超过50个时,曲线水平向左运动
            if (row < 50)
            {
                series1.Points.Add(new SeriesPoint(row, value));//添加新点
                label2.Text = value.ToString();
            }

            else
            {
                if (series1.Points.Count > 0)
                {
                    series1.Points.RemoveAt(0);//删除最左侧的点
                    series1.Points.Add(new SeriesPoint(row, value));//添加新点
                    label2.Text = value.ToString();
                }

            }
        }

        private void Form1_Load(object sender, EventArgs e)
        {
            //定时器
            System.Timers.Timer t = new System.Timers.Timer(1000);//实例化Timer类,设置间隔时间为1000毫秒;
            t.Elapsed  = new System.Timers.ElapsedEventHandler(addPoint);//到达时间的时候执行事件;
            t.AutoReset = true;//设置是执行一次(false)还是一直执行(true);
            t.Enabled = true;//是否执行System.Timers.Timer.Elapsed事件;
            t.Start();//启动

            //设置序列的数字参数比例类型,默认情况下是定性的。
            series1.ArgumentScaleType = ScaleType.Numerical;

            //将线条加入到表中
            pointChart.Series.Add(series1);

            //访问该系列的特定于视图类型的选项。
            PointSeriesView myView1 = (PointSeriesView)series1.View;
            myView1.PointMarkerOptions.Kind = MarkerKind.Circle;
            myView1.PointMarkerOptions.StarPointCount = 5;
            myView1.PointMarkerOptions.Size = 5;
            myView1.PointMarkerOptions.BorderColor = Color.Lime;//点的颜色

            //创建上下限线条
            XYDiagram diagram = (XYDiagram)pointChart.Diagram;
            diagram.DefaultPane.BackColor = Color.LemonChiffon;//背景颜色
            diagram.AxisY.ConstantLines.Clear();
            ConstantLine constantLine1 = new ConstantLine("上限", 30);
            constantLine1.Color = Color.Black;//直线颜色
            constantLine1.Title.TextColor = Color.Black;//直线文本字体颜色
            diagram.AxisY.ConstantLines.Add(constantLine1);
            ConstantLine constantLine2 = new ConstantLine("下限", 20);
            constantLine2.Color = Color.Black;
            constantLine2.Title.TextColor = Color.Black;
            diagram.AxisY.ConstantLines.Add(constantLine2);

            //访问图表的特定于类型的选项。
            ((XYDiagram)pointChart.Diagram).EnableAxisXZooming = true;

            //隐藏图例(如有必要)。
            pointChart.Legend.Visible = false;

            //向图表添加标题(如有必要)。
            pointChart.Titles.Add(new ChartTitle());
            pointChart.Titles[0].Text = "数量表";//标题

            //将图表添加到界面。
            pointChart.Dock = DockStyle.Fill;
            this.Controls.Add(pointChart);

            //设置Y轴最小值和最大值,即默认情况下Y轴显示的范围
            AxisRange DIA = (AxisRange)((XYDiagram)pointChart.Diagram).AxisY.Range;
            DIA.SetMinMaxValues(15, 39);
        }
        private void Button1_Click(object sender, EventArgs e)
        {
            System.Diagnostics.Process.Start("https://www.daboke.com");//欢迎访问大博客!
        }

        private void Button2_Click(object sender, EventArgs e)
        {
            System.Diagnostics.Process.Start("https://www.daboke.com/devexpress1");//原文链接!
        }
    }
}
标签: C# DevExpress ChartControl 曲线
相关软件
小贴士
感谢您为本站写下的评论,您的评论对其它用户来说具有重要的参考价值,所以请认真填写。
- 类似“顶”、“沙发”之类没有营养的文字,对勤劳贡献的楼主来说是令人沮丧的反馈信息。
- 相信您也不想看到一排文字/表情墙,所以请不要反馈意义不大的重复字符,也请尽量不要纯表情的回复。
- 提问之前请再仔细看一遍楼主的说明,或许是您遗漏了。
- 请勿到处挖坑绊人、招贴广告。既占空间让人厌烦,又没人会搭理,于人于己都无利。
关于好例子网
本站旨在为广大IT学习爱好者提供一个非营利性互相学习交流分享平台。本站所有资源都可以被免费获取学习研究。本站资源来自网友分享,对搜索内容的合法性不具有预见性、识别性、控制性,仅供学习研究,请务必在下载后24小时内给予删除,不得用于其他任何用途,否则后果自负。基于互联网的特殊性,平台无法对用户传输的作品、信息、内容的权属或合法性、安全性、合规性、真实性、科学性、完整权、有效性等进行实质审查;无论平台是否已进行审查,用户均应自行承担因其传输的作品、信息、内容而可能或已经产生的侵权或权属纠纷等法律责任。本站所有资源不代表本站的观点或立场,基于网友分享,根据中国法律《信息网络传播权保护条例》第二十二与二十三条之规定,若资源存在侵权或相关问题请联系本站客服人员,点此联系我们。关于更多版权及免责申明参见 版权及免责申明

网友评论
我要评论