
实例介绍
【实例简介】
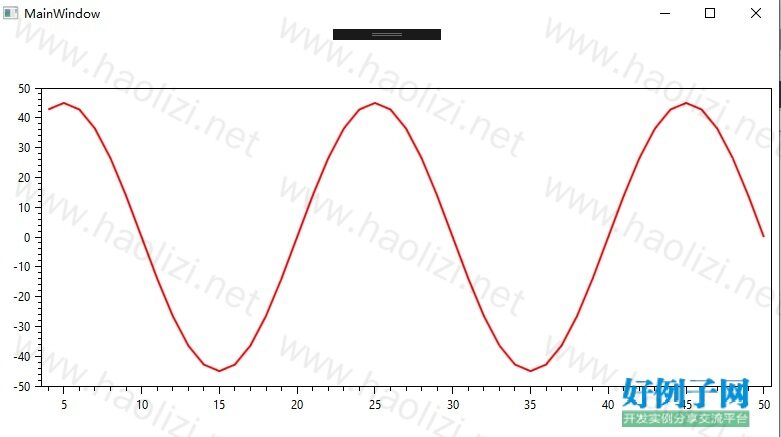
C#使用oxyplot绘制曲线图
【实例截图】
【核心代码】
public class DataInfo
{
public double Time { get; set; }
public double Value { get; set; }
public DataInfo(double time, double value)
{
Time = time;
Value = value;
}
}
/// <summary>
/// Interaction logic for MainWindow.xaml
/// </summary>
public partial class MainWindow : Window
{
public List<DataInfo> mListDataInfo1 { get; private set; } = new List<DataInfo>();
public List<DataInfo> mListDataInfo2 { get; private set; } = new List<DataInfo>();
Timer timer5 = new Timer();
public MainWindow()
{
InitializeComponent();
timer5.Interval = 200;
timer5.Elapsed = Timer5_Elapsed;
timer5.Start();
}
int timerCnt = 0;
DateTime dateTime = DateTime.Today.Add(TimeSpan.FromHours(9));
private void Timer5_Elapsed(object sender, ElapsedEventArgs e)
{
timerCnt ;
Dispatcher.Invoke(new Action(() =>
{
DateTime dateTime = DateTime.Now;
mListDataInfo1.Add(new DataInfo(timerCnt, 45*Math.Sin(Math.PI*(timerCnt/10f))));
mListDataInfo2.Add(new DataInfo(timerCnt, 10));
//dateTime = dateTime.AddMinutes(1);
myLineSeries.DataContext = this;
//myLineSeries2.DataContext =this;
if (mListDataInfo1.Count > 200)
{
mListDataInfo1.RemoveRange(0,150);
}
myPlot.InvalidatePlot(true);
}), null);
}
}
小贴士
感谢您为本站写下的评论,您的评论对其它用户来说具有重要的参考价值,所以请认真填写。
- 类似“顶”、“沙发”之类没有营养的文字,对勤劳贡献的楼主来说是令人沮丧的反馈信息。
- 相信您也不想看到一排文字/表情墙,所以请不要反馈意义不大的重复字符,也请尽量不要纯表情的回复。
- 提问之前请再仔细看一遍楼主的说明,或许是您遗漏了。
- 请勿到处挖坑绊人、招贴广告。既占空间让人厌烦,又没人会搭理,于人于己都无利。
关于好例子网
本站旨在为广大IT学习爱好者提供一个非营利性互相学习交流分享平台。本站所有资源都可以被免费获取学习研究。本站资源来自网友分享,对搜索内容的合法性不具有预见性、识别性、控制性,仅供学习研究,请务必在下载后24小时内给予删除,不得用于其他任何用途,否则后果自负。基于互联网的特殊性,平台无法对用户传输的作品、信息、内容的权属或合法性、安全性、合规性、真实性、科学性、完整权、有效性等进行实质审查;无论平台是否已进行审查,用户均应自行承担因其传输的作品、信息、内容而可能或已经产生的侵权或权属纠纷等法律责任。本站所有资源不代表本站的观点或立场,基于网友分享,根据中国法律《信息网络传播权保护条例》第二十二与二十三条之规定,若资源存在侵权或相关问题请联系本站客服人员,点此联系我们。关于更多版权及免责申明参见 版权及免责申明

网友评论
我要评论