实例介绍
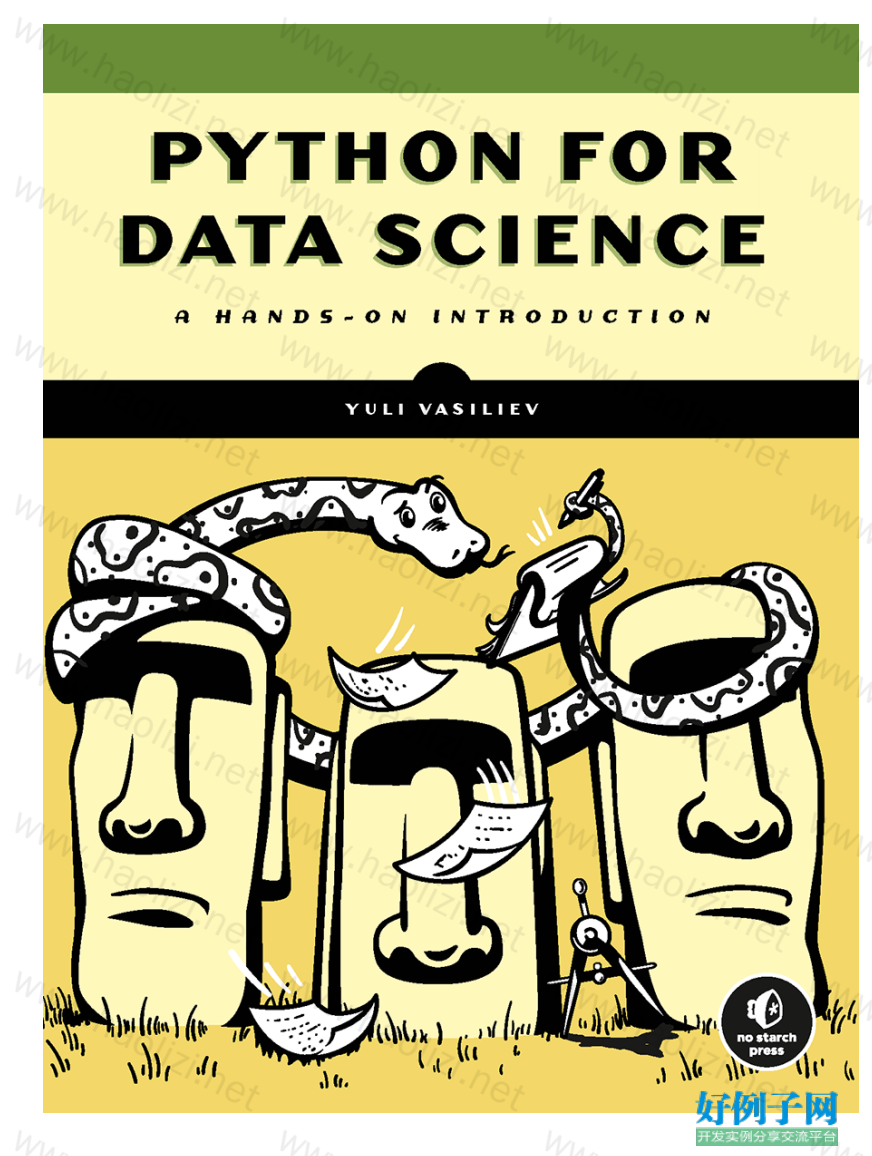
【实例简介】Python for Data Science:用于数据科学的 Python
Python是访问、操作和从各种数据中获取见解的理想选择。Python for Data Science通过一种基于实际示例和实践活动的边做边学的方法,向您介绍了数据分析的Python世界。您将学习如何编写Python代码来获取、转换和分析数据,为业务管理、营销和决策支持中的用例实践最先进的数据处理技术。
您将发现Python用于基本操作的丰富内置数据结构,以及用于数据科学的健壮的开源库生态系统,包括NumPy、pandas、scikit-learn、matplotlib等。示例展示了如何以各种格式加载数据,如何精简、分组和聚合数据集,以及如何创建图表、地图和其他可视化效果。后面的章节深入演示了真实世界的数据应用,包括使用位置数据为出租车服务提供动力,用购物篮分析来识别共同购买的商品,用机器学习来预测股票价格。
【核心代码】
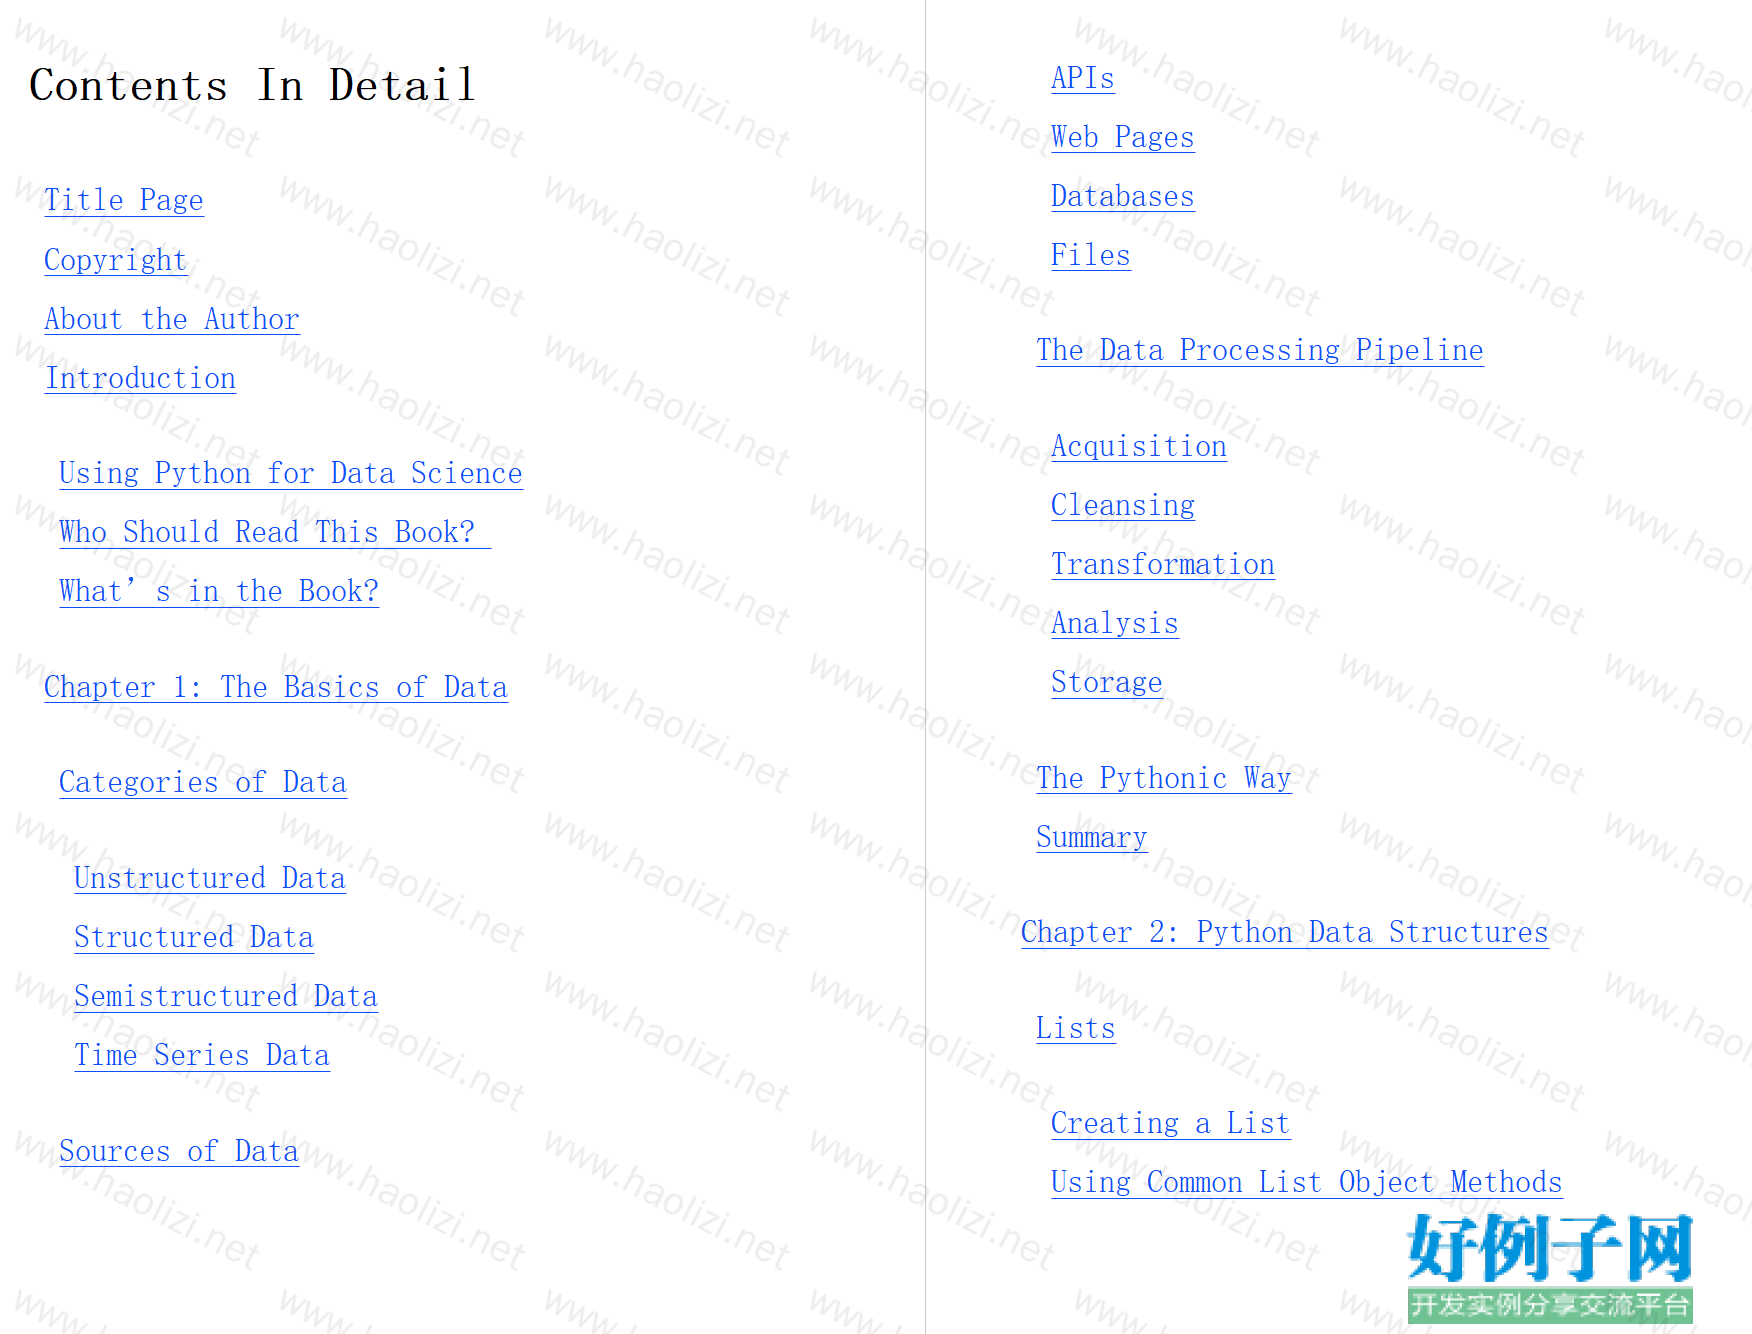
Contents In Detail
Title Page
Copyright
About the Author
Introduction
Using Python for Data Science
Who Should Read This Book?
What’s in the Book?
Chapter 1: The Basics of Data
Categories of Data
Unstructured Data
Structured Data
Semistructured Data
Time Series Data
Sources of Data
APIs
Web Pages
Databases
Files
The Data Processing Pipeline
Acquisition
Cleansing
Transformation
Analysis
Storage
The Pythonic Way
Summary
Chapter 2: Python Data Structures
Lists
Creating a List
Using Common List Object Methods
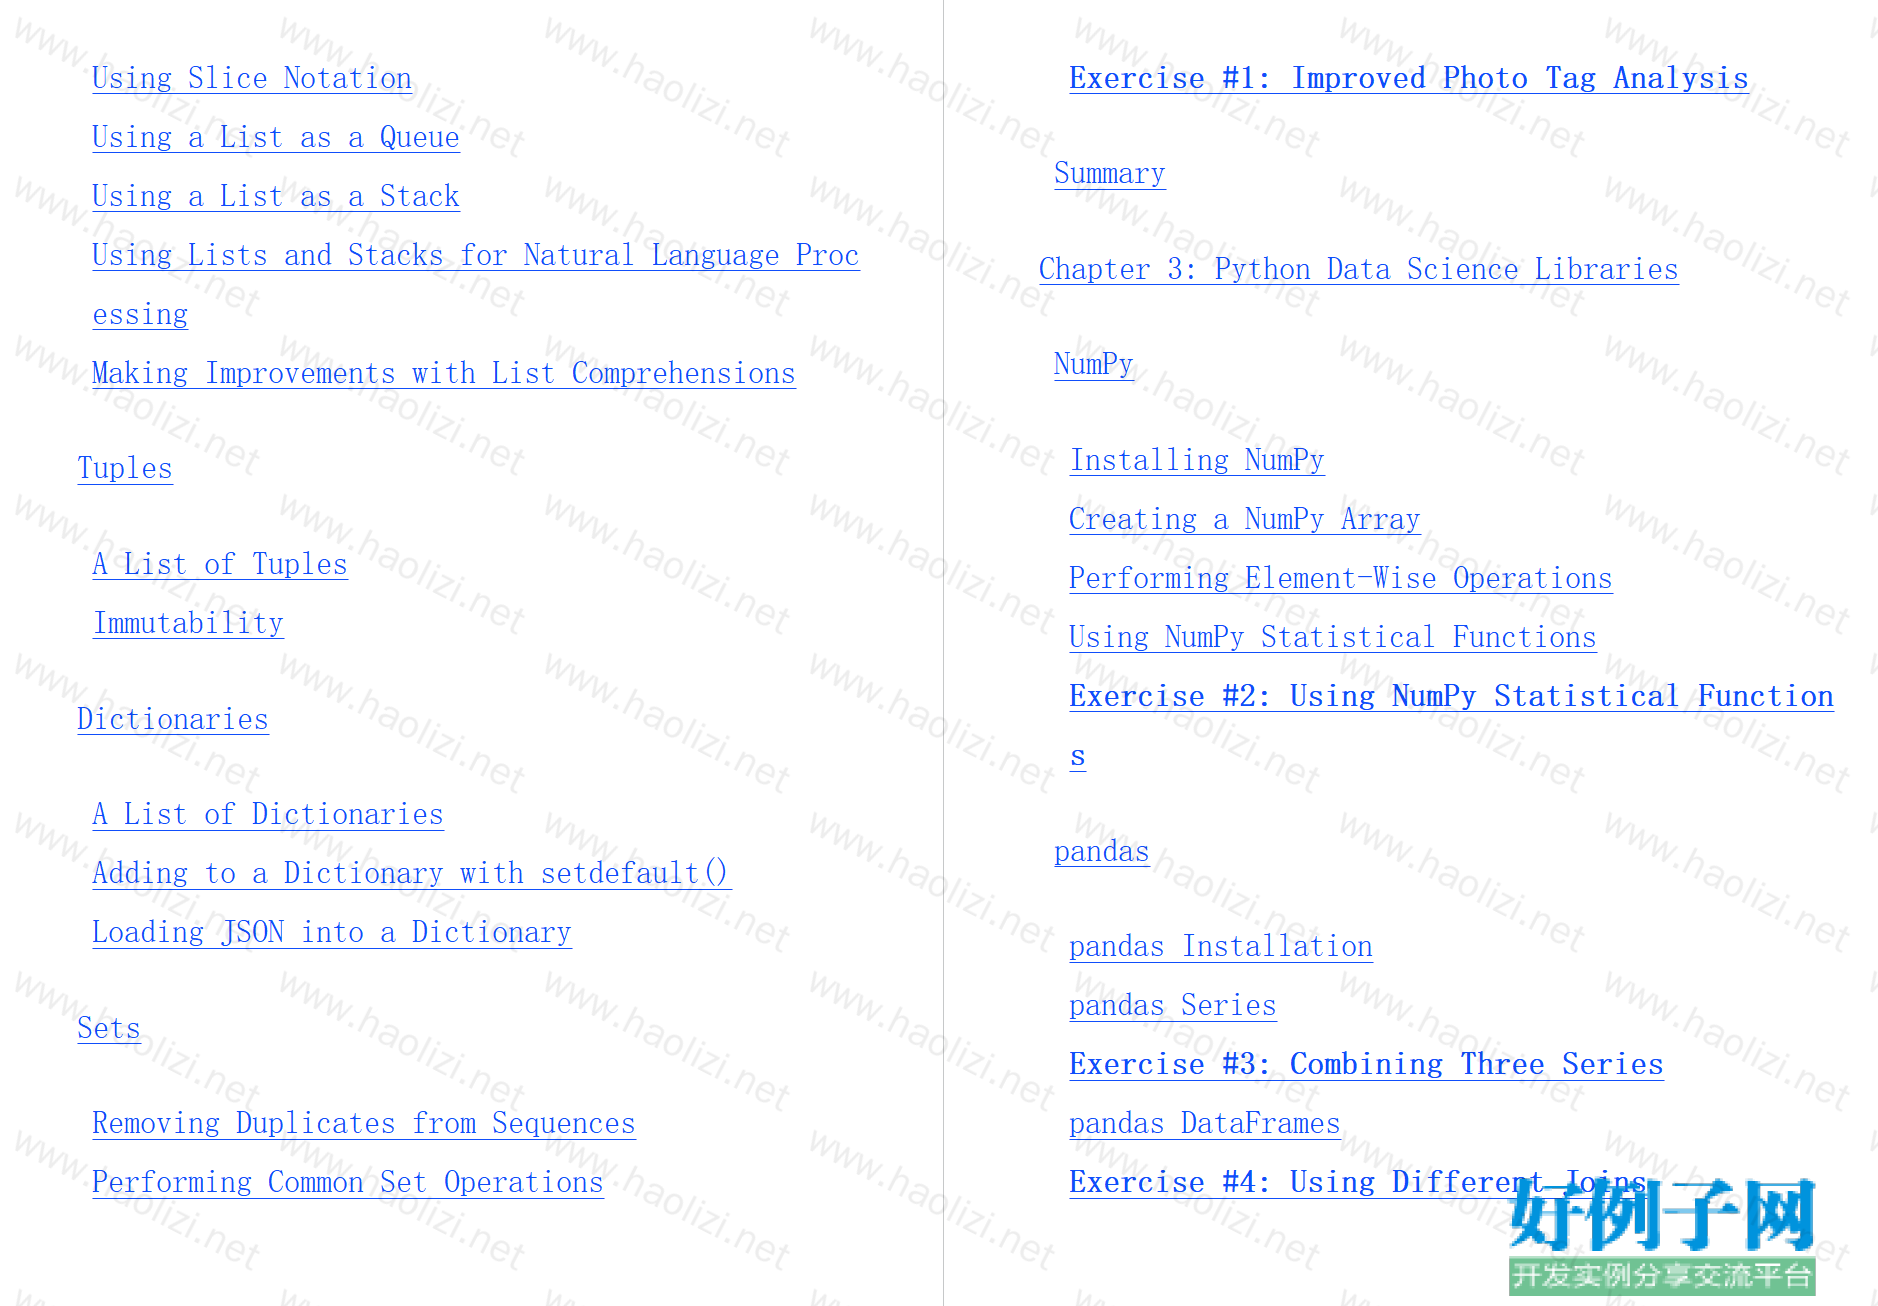
Using Slice Notation
Using a List as a Queue
Using a List as a Stack
Using Lists and Stacks for Natural Language Processing
Making Improvements with List Comprehensions
Tuples
A List of Tuples
Immutability
Dictionaries
A List of Dictionaries
Adding to a Dictionary with setdefault()
Loading JSON into a Dictionary
Sets
Removing Duplicates from Sequences
Performing Common Set Operations
Exercise #1: Improved Photo Tag Analysis
Summary
Chapter 3: Python Data Science Libraries
NumPy
Installing NumPy
Creating a NumPy Array
Performing Element-Wise Operations
Using NumPy Statistical Functions
Exercise #2: Using NumPy Statistical Functions
pandas
pandas Installation
pandas Series
Exercise #3: Combining Three Series
pandas DataFrames
Exercise #4: Using Different Joins
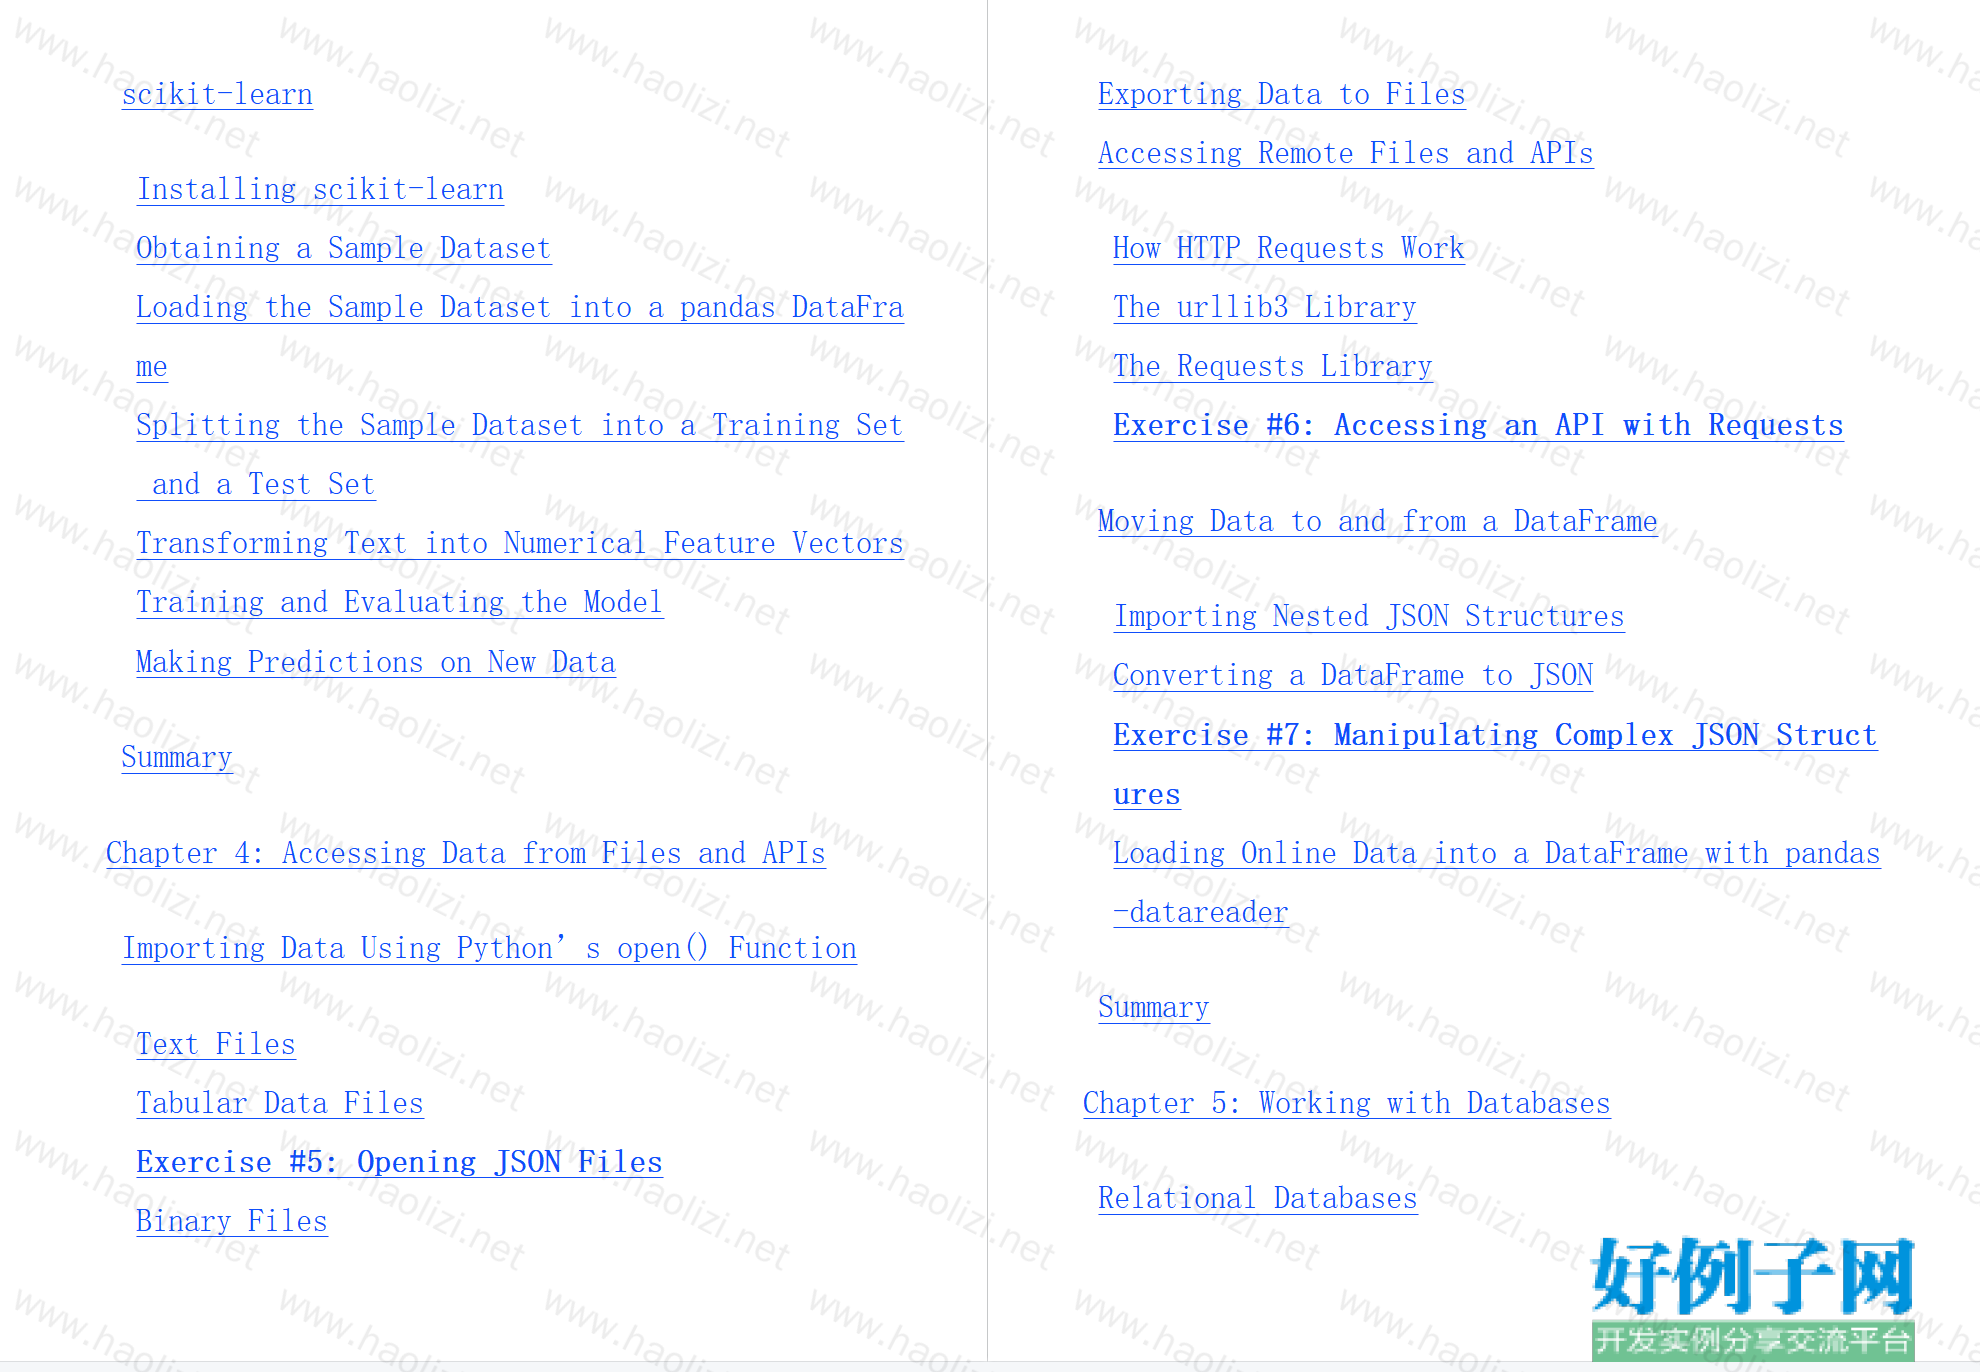
scikit-learn
Installing scikit-learn
Obtaining a Sample Dataset
Loading the Sample Dataset into a pandas DataFrame
Splitting the Sample Dataset into a Training Set and a Test Set
Transforming Text into Numerical Feature Vectors
Training and Evaluating the Model
Making Predictions on New Data
Summary
Chapter 4: Accessing Data from Files and APIs
Importing Data Using Python’s open() Function
Text Files
Tabular Data Files
Exercise #5: Opening JSON Files
Binary Files
Exporting Data to Files
Accessing Remote Files and APIs
How HTTP Requests Work
The urllib3 Library
The Requests Library
Exercise #6: Accessing an API with Requests
Moving Data to and from a DataFrame
Importing Nested JSON Structures
Converting a DataFrame to JSON
Exercise #7: Manipulating Complex JSON Structures
Loading Online Data into a DataFrame with pandas-datareader
Summary
Chapter 5: Working with Databases
Relational Databases
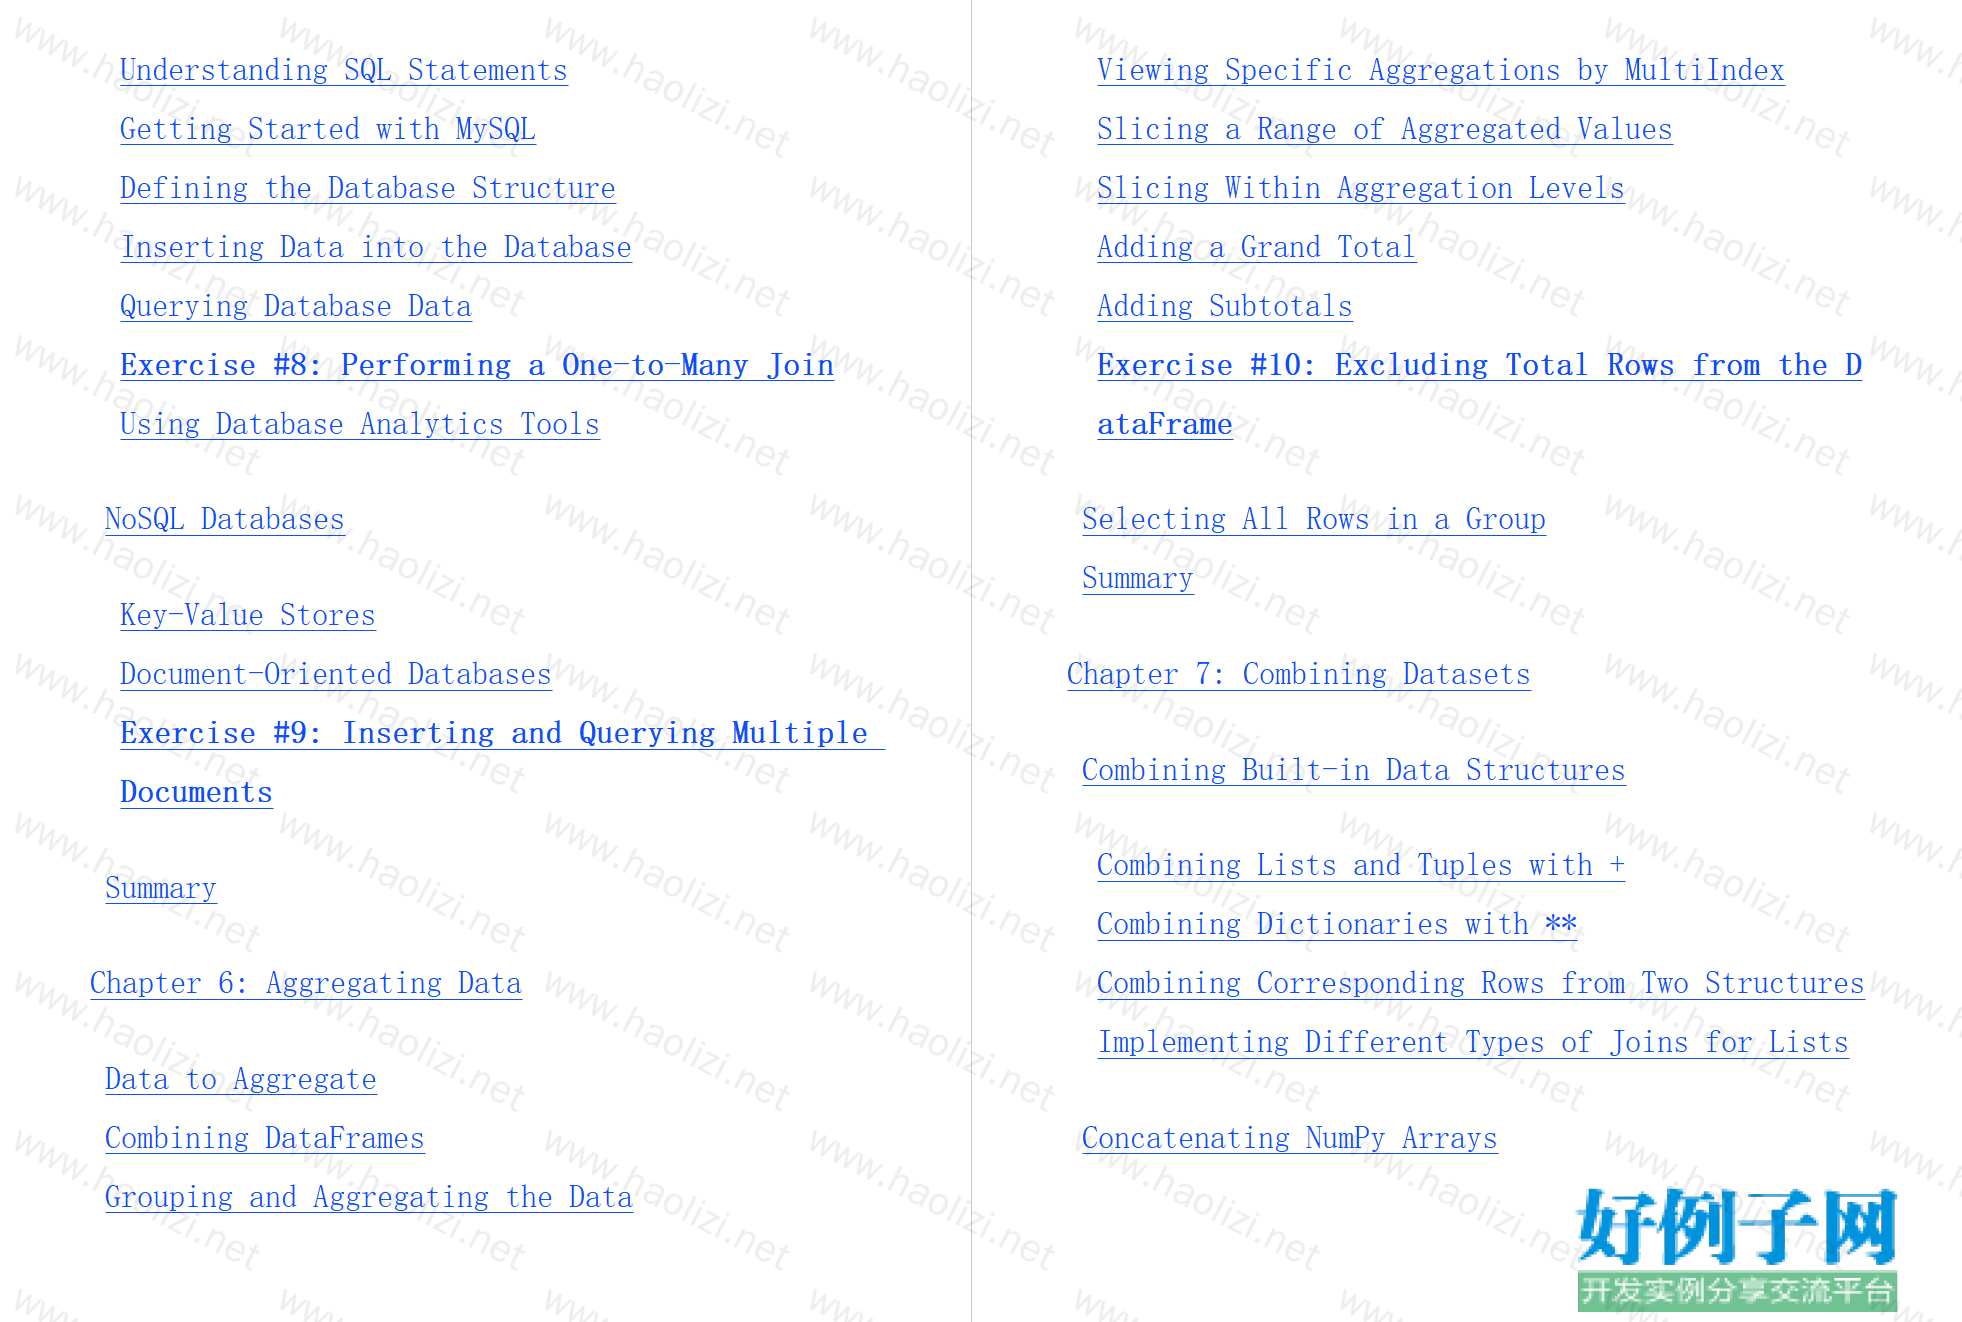
Understanding SQL Statements
Getting Started with MySQL
Defining the Database Structure
Inserting Data into the Database
Querying Database Data
Exercise #8: Performing a One-to-Many Join
Using Database Analytics Tools
NoSQL Databases
Key-Value Stores
Document-Oriented Databases
Exercise #9: Inserting and Querying Multiple Documents
Summary
Chapter 6: Aggregating Data
Data to Aggregate
Combining DataFrames
Grouping and Aggregating the Data
Viewing Specific Aggregations by MultiIndex
Slicing a Range of Aggregated Values
Slicing Within Aggregation Levels
Adding a Grand Total
Adding Subtotals
Exercise #10: Excluding Total Rows from the DataFrame
Selecting All Rows in a Group
Summary
Chapter 7: Combining Datasets
Combining Built-in Data Structures
Combining Lists and Tuples with
Combining Dictionaries with **
Combining Corresponding Rows from Two Structures
Implementing Different Types of Joins for Lists
Concatenating NumPy Arrays
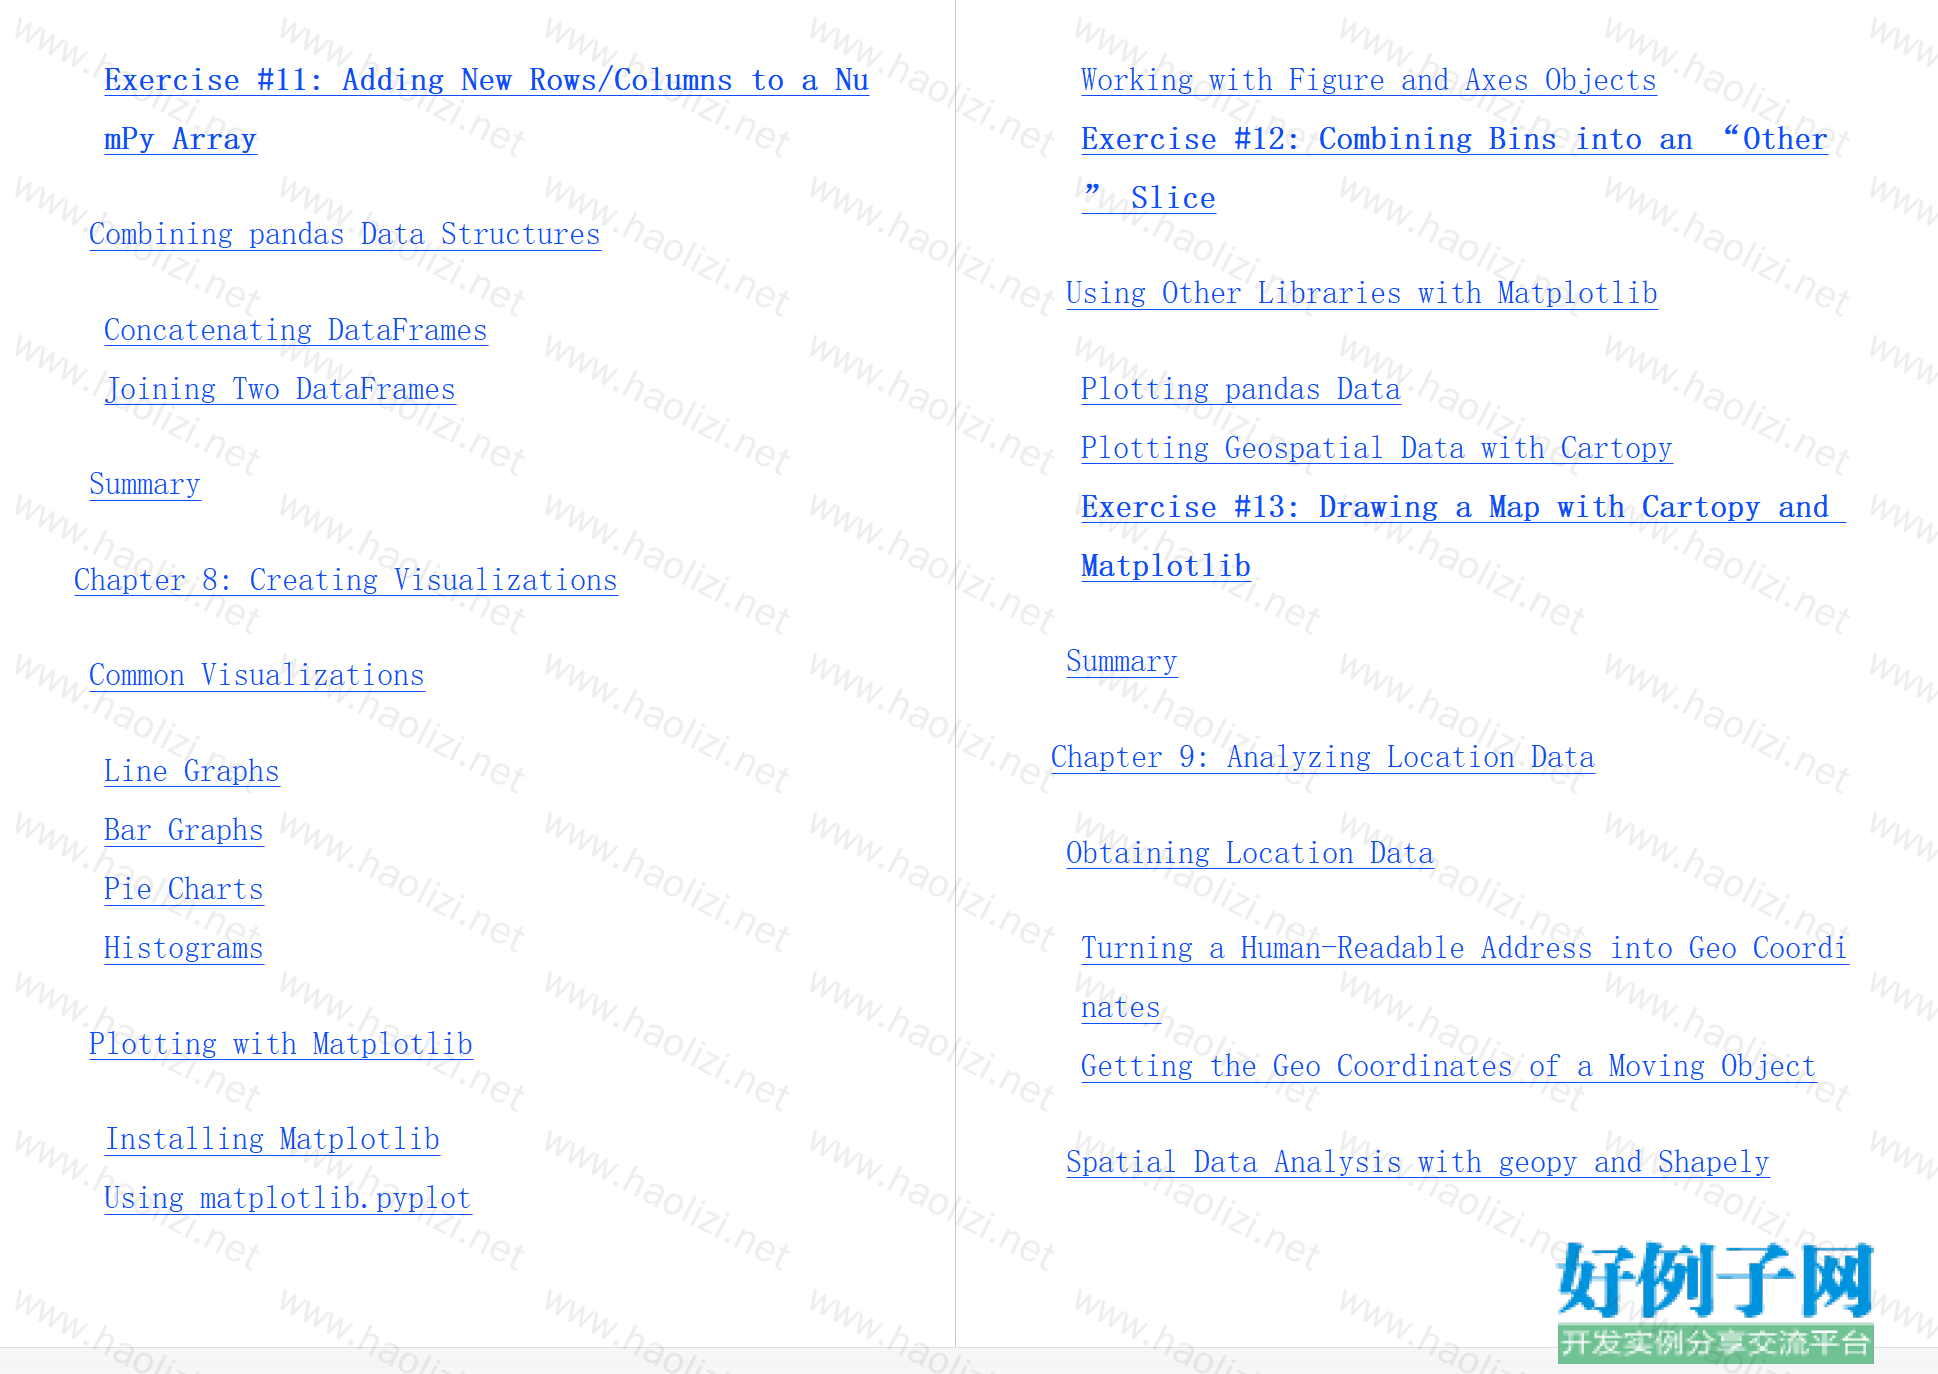
Exercise #11: Adding New Rows/Columns to a NumPy Array
Combining pandas Data Structures
Concatenating DataFrames
Joining Two DataFrames
Summary
Chapter 8: Creating Visualizations
Common Visualizations
Line Graphs
Bar Graphs
Pie Charts
Histograms
Plotting with Matplotlib
Installing Matplotlib
Using matplotlib.pyplot
Working with Figure and Axes Objects
Exercise #12: Combining Bins into an “Other” Slice
Using Other Libraries with Matplotlib
Plotting pandas Data
Plotting Geospatial Data with Cartopy
Exercise #13: Drawing a Map with Cartopy and Matplotlib
Summary
Chapter 9: Analyzing Location Data
Obtaining Location Data
Turning a Human-Readable Address into Geo Coordinates
Getting the Geo Coordinates of a Moving Object
Spatial Data Analysis with geopy and Shapely
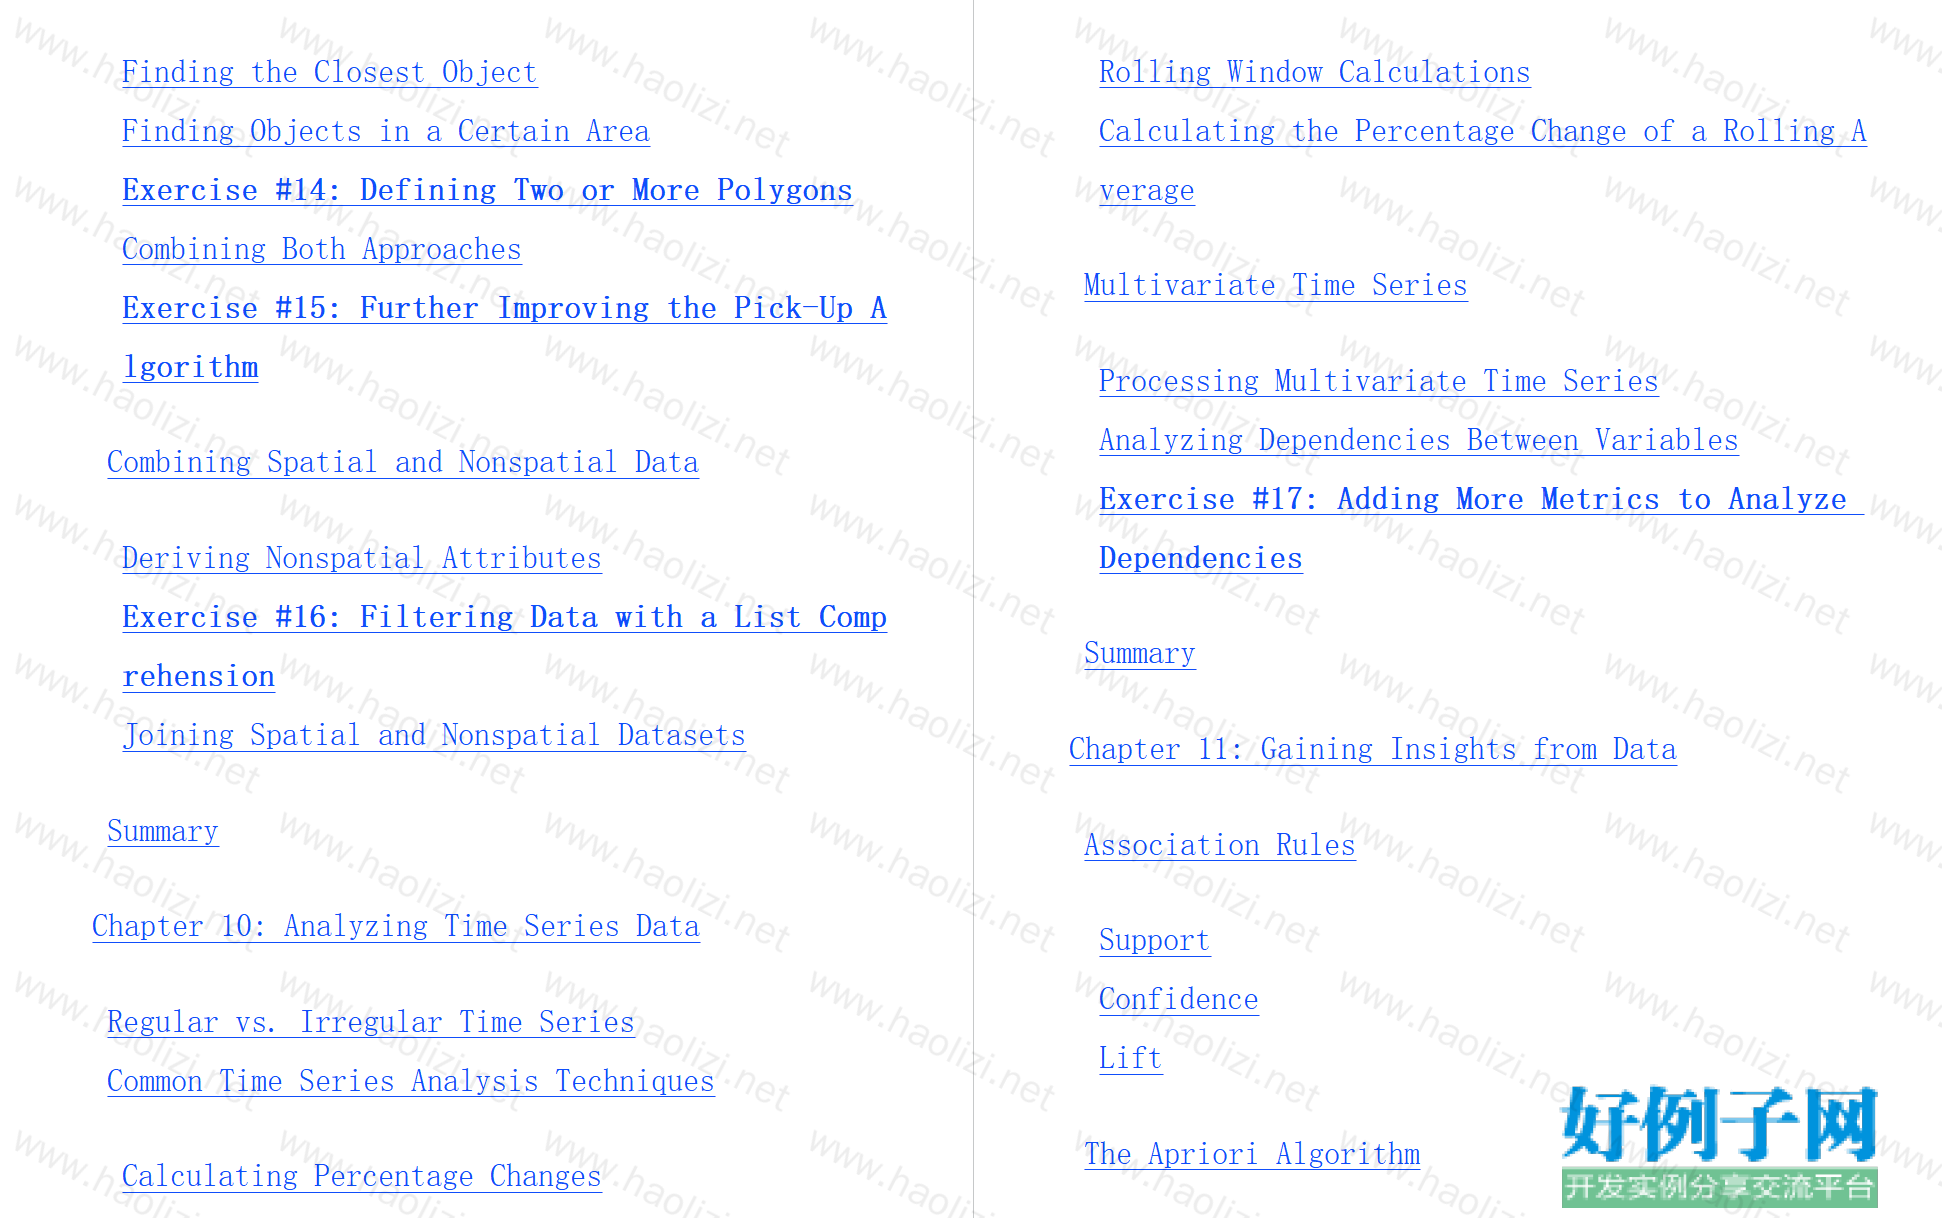
Finding the Closest Object
Finding Objects in a Certain Area
Exercise #14: Defining Two or More Polygons
Combining Both Approaches
Exercise #15: Further Improving the Pick-Up Algorithm
Combining Spatial and Nonspatial Data
Deriving Nonspatial Attributes
Exercise #16: Filtering Data with a List Comprehension
Joining Spatial and Nonspatial Datasets
Summary
Chapter 10: Analyzing Time Series Data
Regular vs. Irregular Time Series
Common Time Series Analysis Techniques
Calculating Percentage Changes
Rolling Window Calculations
Calculating the Percentage Change of a Rolling Average
Multivariate Time Series
Processing Multivariate Time Series
Analyzing Dependencies Between Variables
Exercise #17: Adding More Metrics to Analyze Dependencies
Summary
Chapter 11: Gaining Insights from Data
Association Rules
Support
Confidence
Lift
The Apriori Algorithm
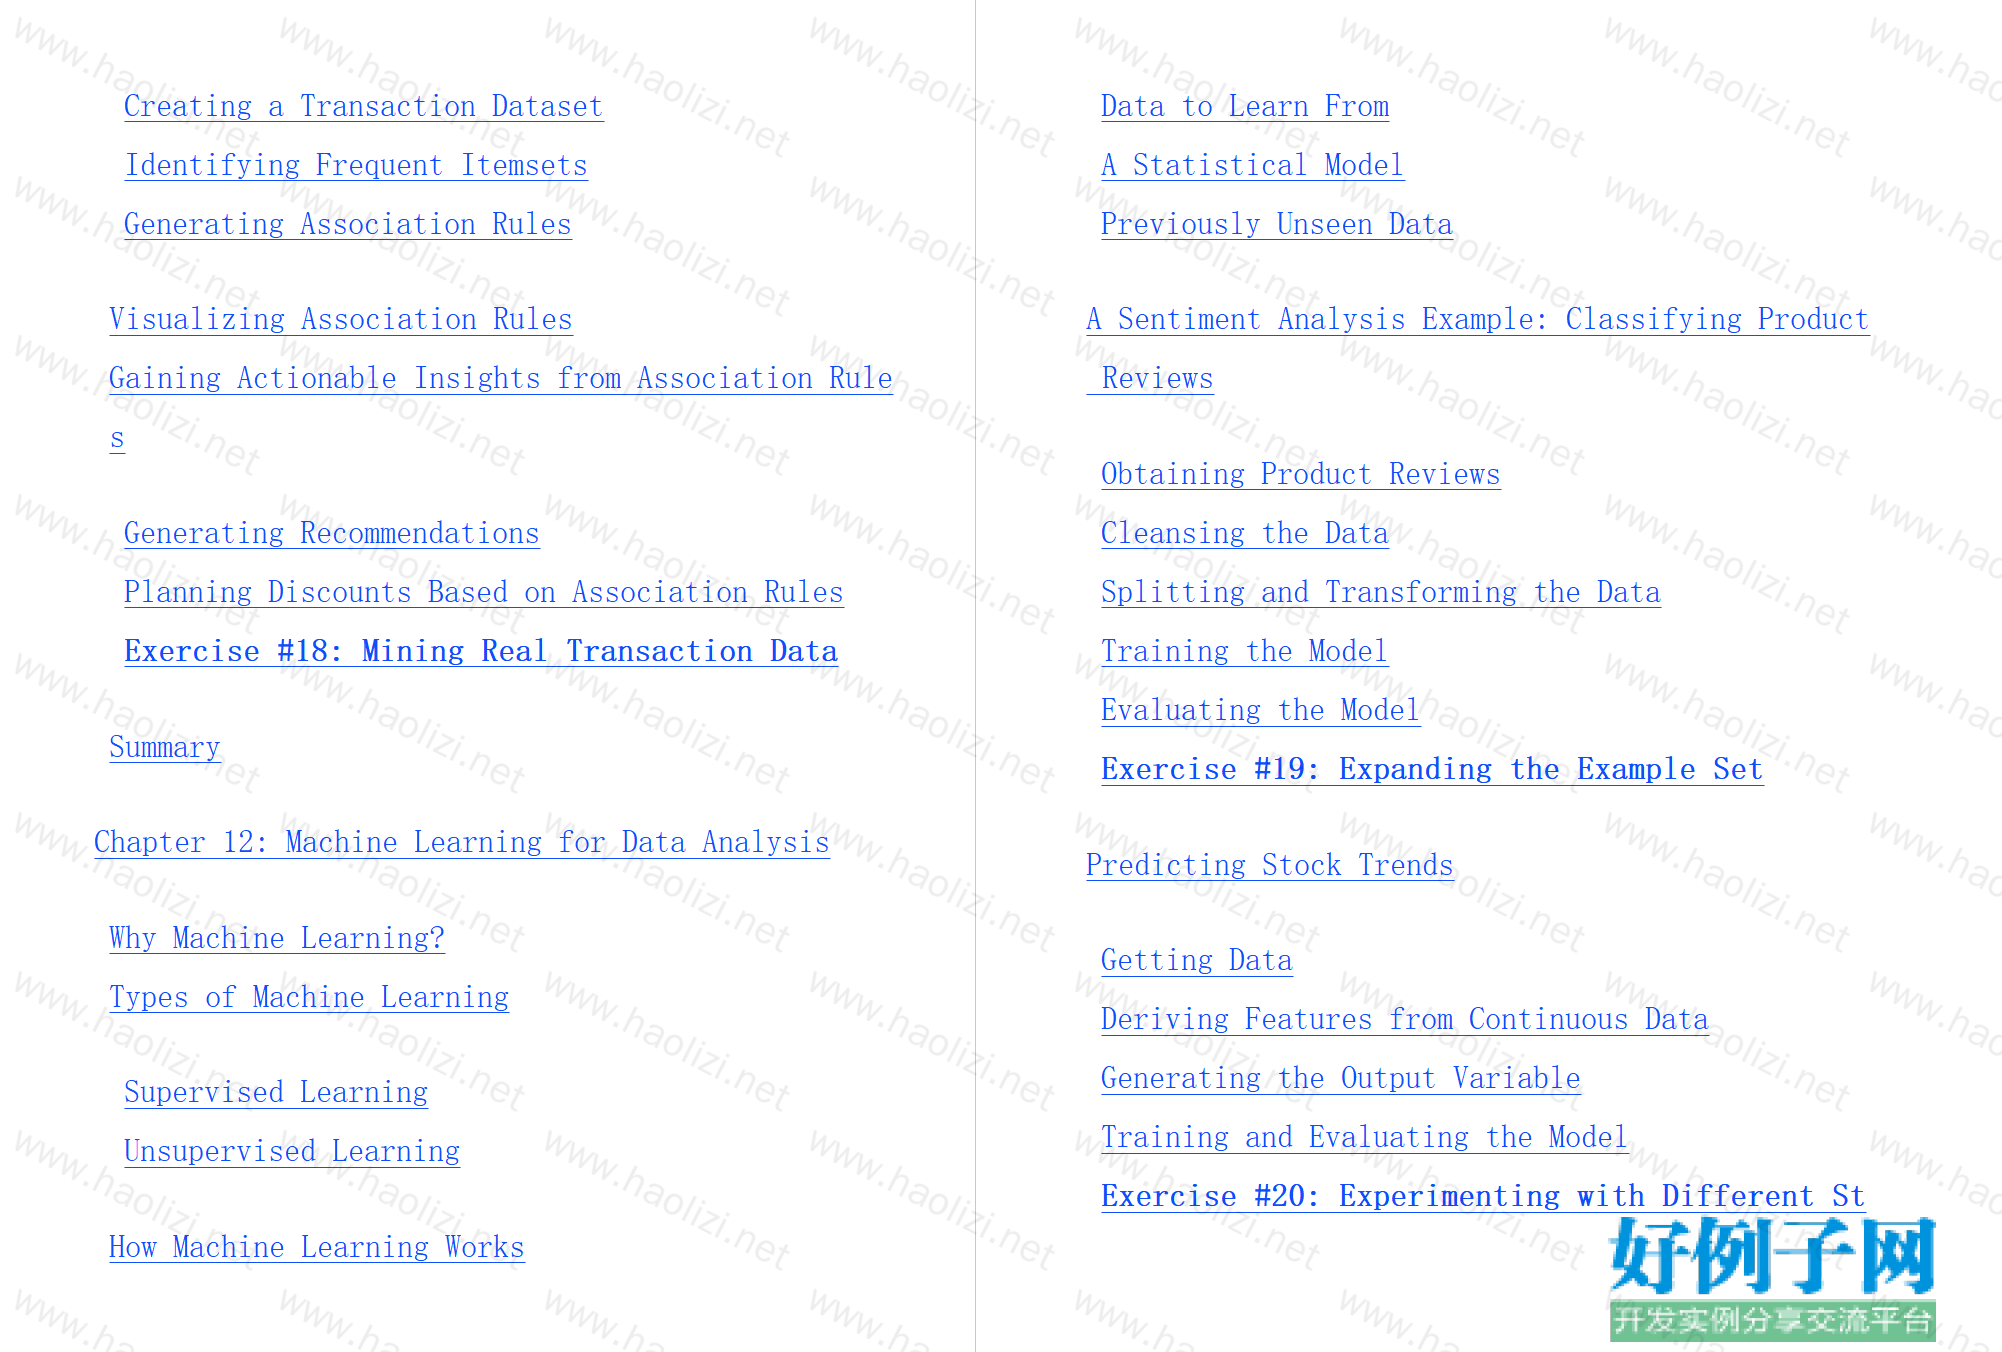
Creating a Transaction Dataset
Identifying Frequent Itemsets
Generating Association Rules
Visualizing Association Rules
Gaining Actionable Insights from Association Rules
Generating Recommendations
Planning Discounts Based on Association Rules
Exercise #18: Mining Real Transaction Data
Summary
Chapter 12: Machine Learning for Data Analysis
Why Machine Learning?
Types of Machine Learning
Supervised Learning
Unsupervised Learning
How Machine Learning Works
Data to Learn From
A Statistical Model
Previously Unseen Data
A Sentiment Analysis Example: Classifying Product Reviews
Obtaining Product Reviews
Cleansing the Data
Splitting and Transforming the Data
Training the Model
Evaluating the Model
Exercise #19: Expanding the Example Set
Predicting Stock Trends
Getting Data
Deriving Features from Continuous Data
Generating the Output Variable
Training and Evaluating the Model
Exercise #20: Experimenting with Different Stocks and New Metrics
Summary
Index
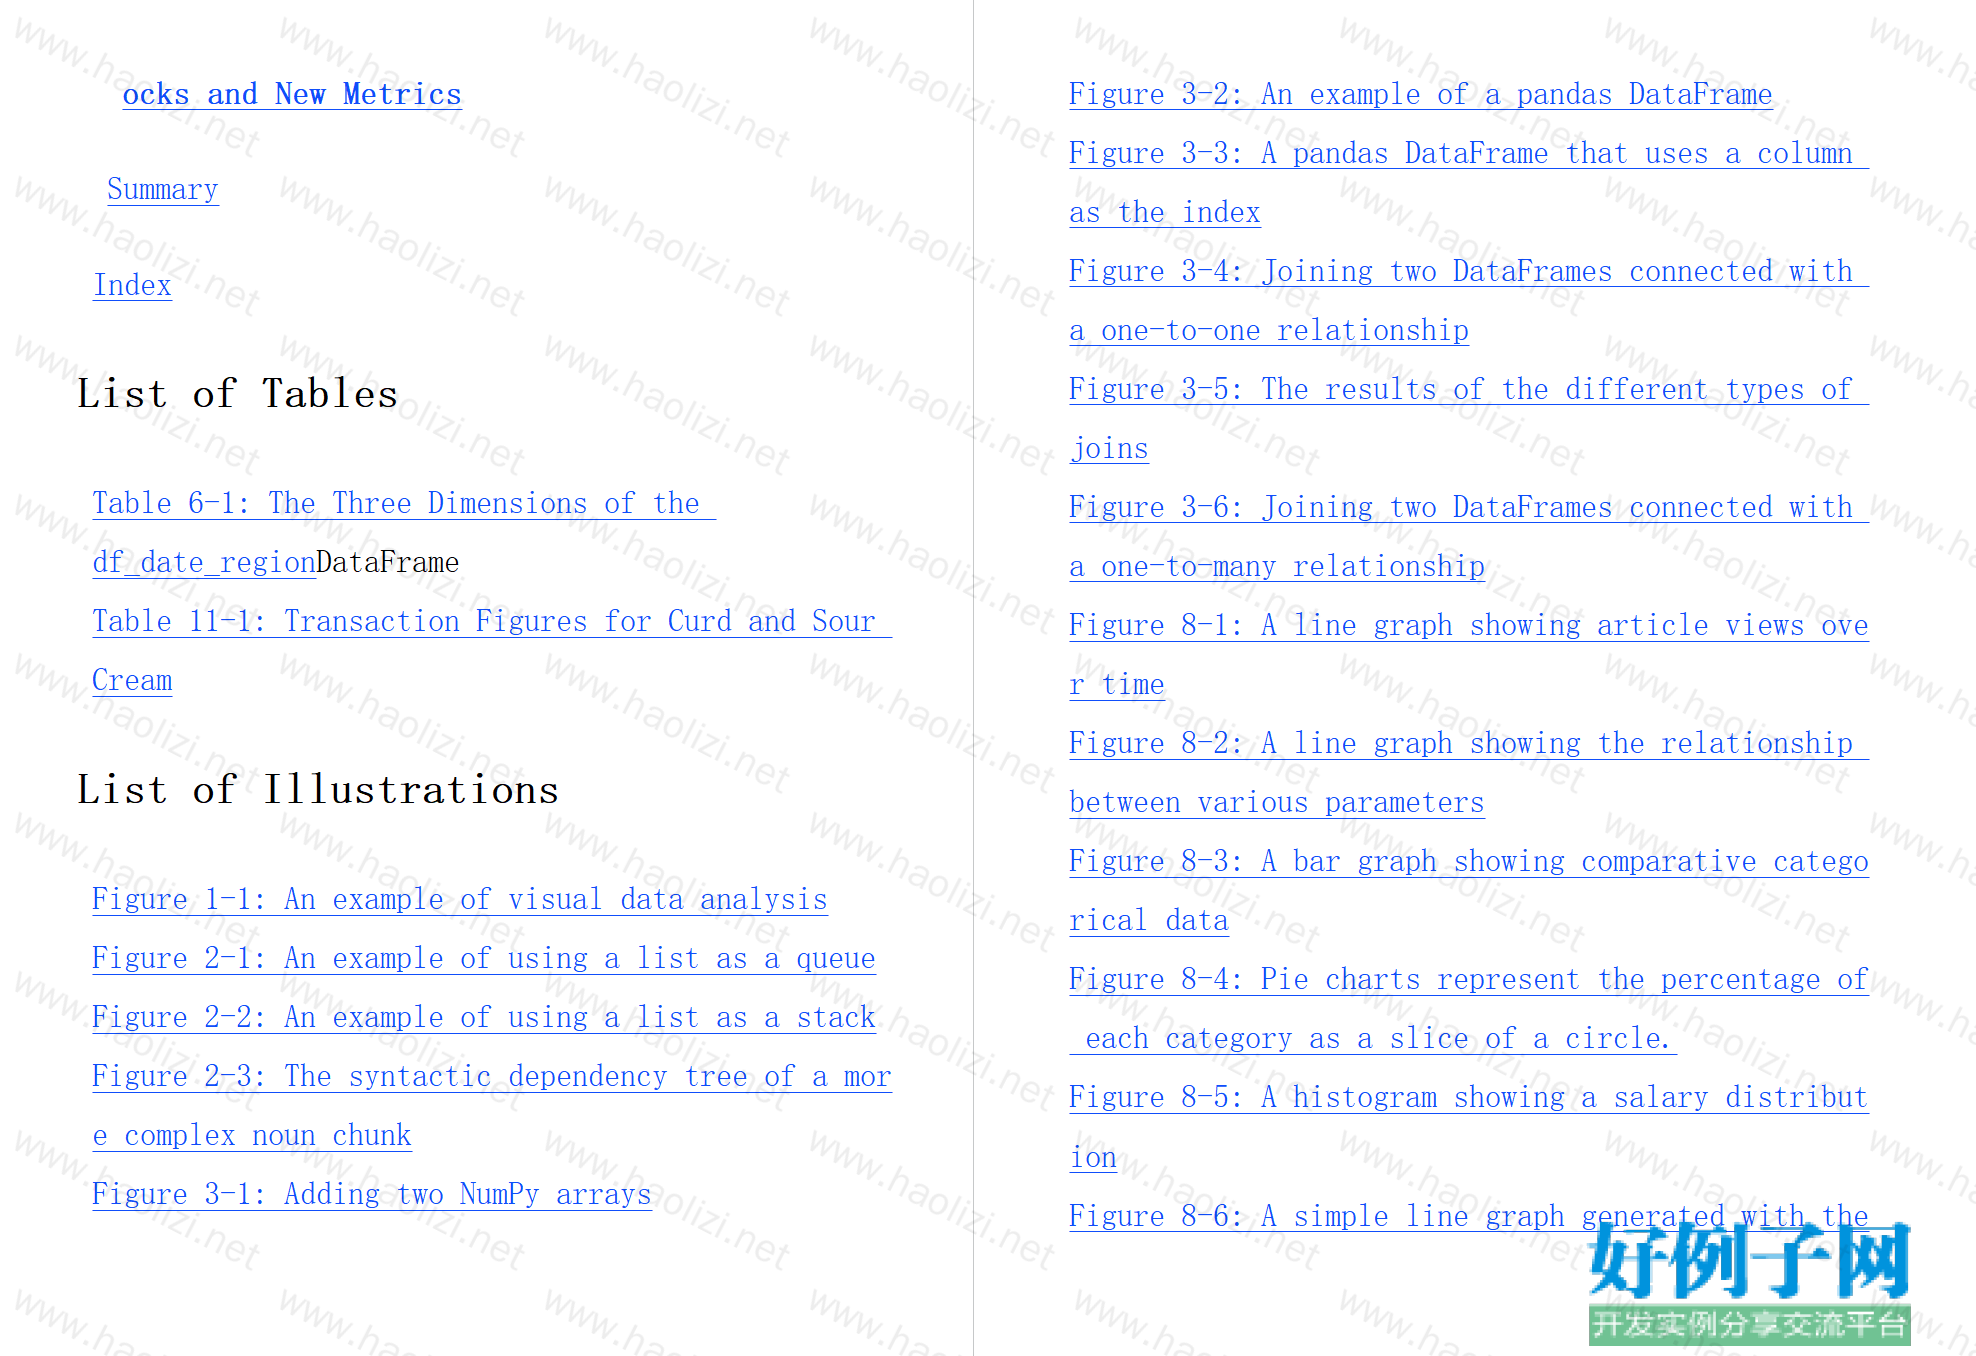
List of Tables
Table 6-1: The Three Dimensions of the df_date_regionDataFrame
Table 11-1: Transaction Figures for Curd and Sour Cream
List of Illustrations
Figure 1-1: An example of visual data analysis
Figure 2-1: An example of using a list as a queue
Figure 2-2: An example of using a list as a stack
Figure 2-3: The syntactic dependency tree of a more complex noun chunk
Figure 3-1: Adding two NumPy arrays
Figure 3-2: An example of a pandas DataFrame
Figure 3-3: A pandas DataFrame that uses a column as the index
Figure 3-4: Joining two DataFrames connected with a one-to-one relationship
Figure 3-5: The results of the different types of joins
Figure 3-6: Joining two DataFrames connected with a one-to-many relationship
Figure 8-1: A line graph showing article views over time
Figure 8-2: A line graph showing the relationship between various parameters
Figure 8-3: A bar graph showing comparative categorical data
Figure 8-4: Pie charts represent the percentage of each category as a slice of a circle.
Figure 8-5: A histogram showing a salary distribution
Figure 8-6: A simple line graph generated with thematplotlib.pyplotmodule
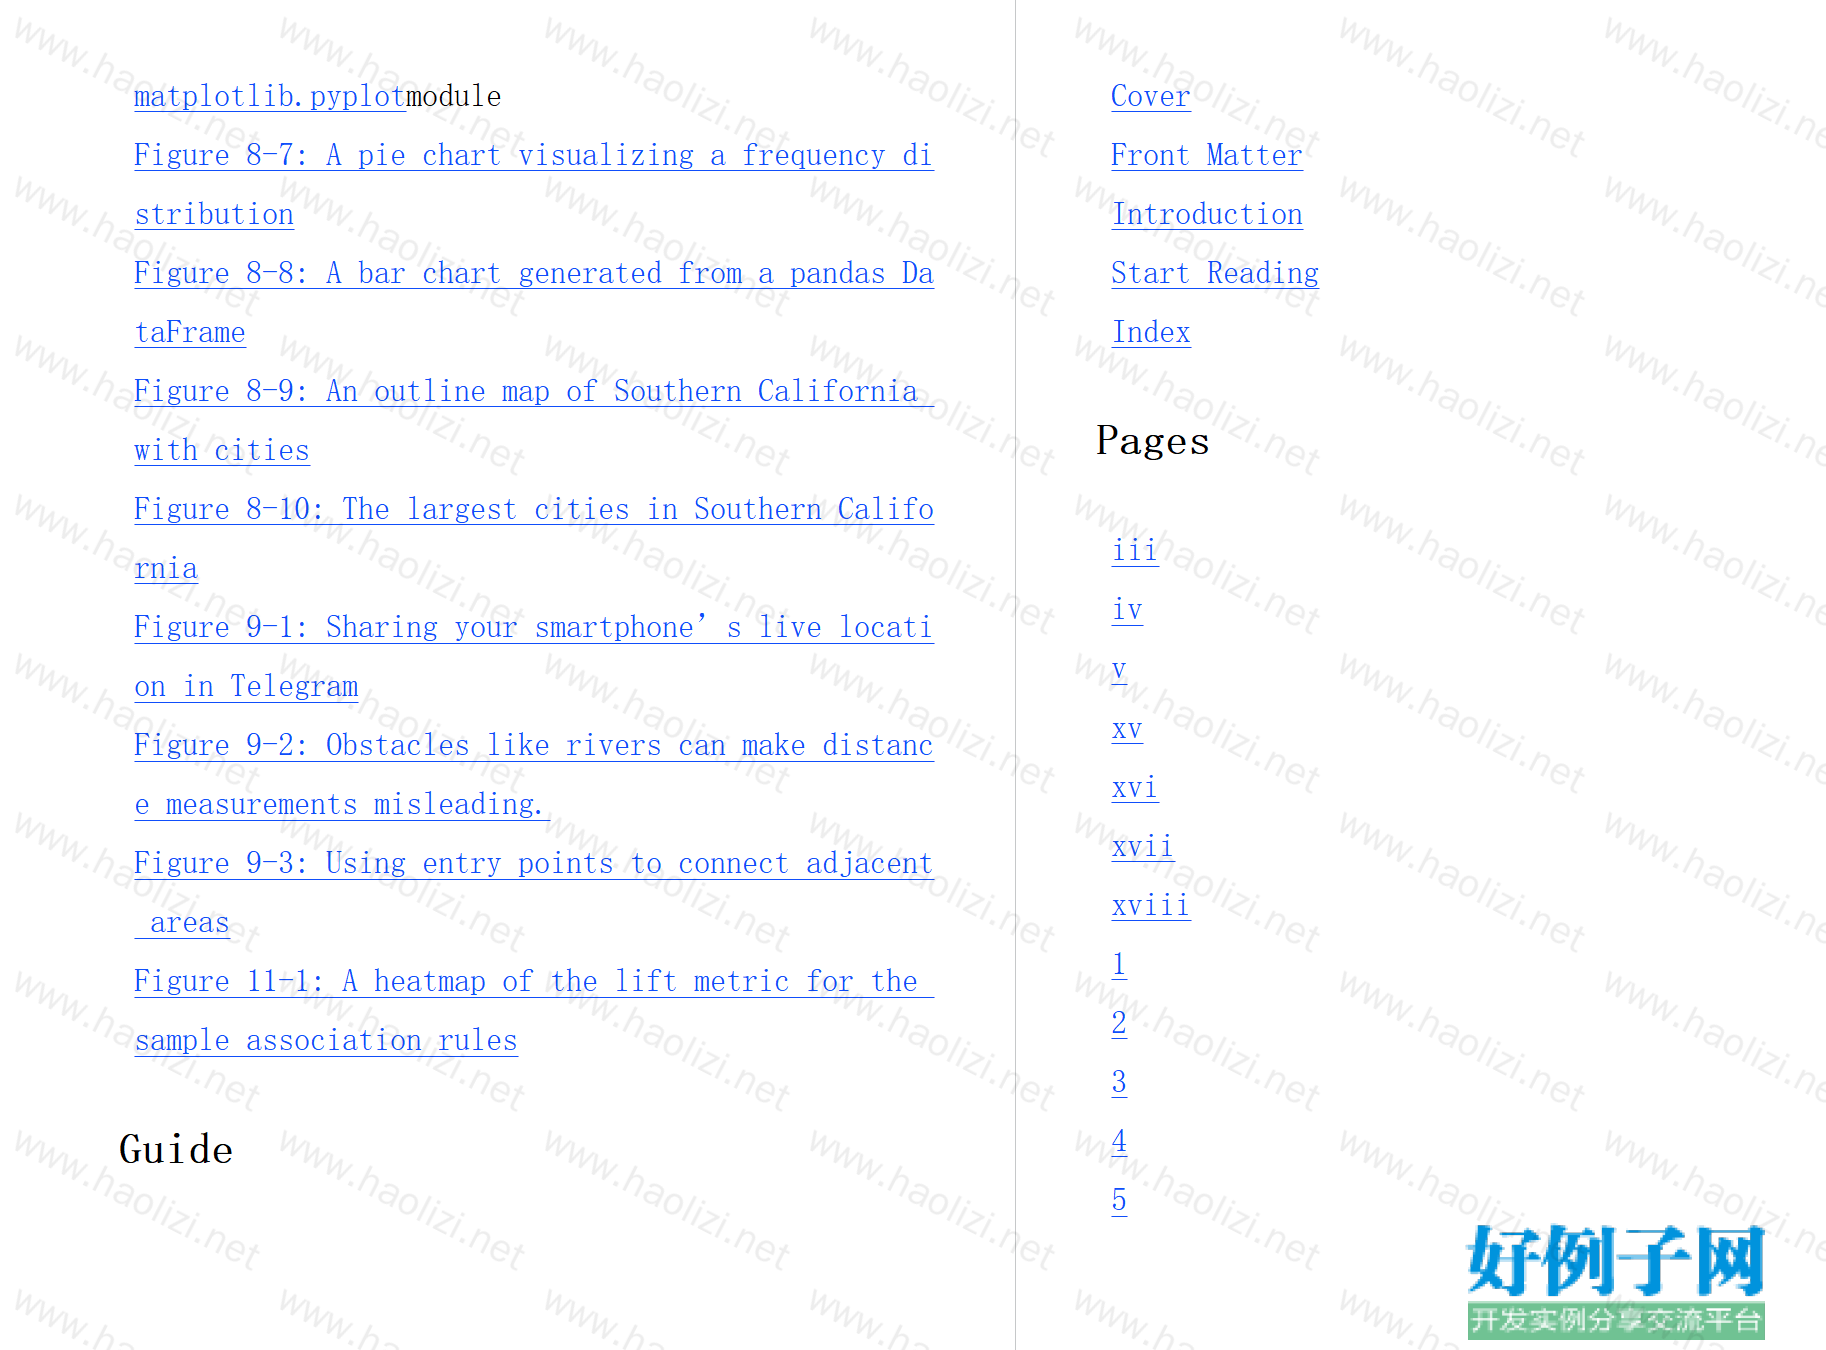
Figure 8-7: A pie chart visualizing a frequency distribution
Figure 8-8: A bar chart generated from a pandas DataFrame
Figure 8-9: An outline map of Southern California with cities
Figure 8-10: The largest cities in Southern California
Figure 9-1: Sharing your smartphone’s live location in Telegram
Figure 9-2: Obstacles like rivers can make distance measurements misleading.
Figure 9-3: Using entry points to connect adjacent areas
Figure 11-1: A heatmap of the lift metric for the sample association rules
标签: Data Science Science python data SCI
相关软件
小贴士
感谢您为本站写下的评论,您的评论对其它用户来说具有重要的参考价值,所以请认真填写。
- 类似“顶”、“沙发”之类没有营养的文字,对勤劳贡献的楼主来说是令人沮丧的反馈信息。
- 相信您也不想看到一排文字/表情墙,所以请不要反馈意义不大的重复字符,也请尽量不要纯表情的回复。
- 提问之前请再仔细看一遍楼主的说明,或许是您遗漏了。
- 请勿到处挖坑绊人、招贴广告。既占空间让人厌烦,又没人会搭理,于人于己都无利。
关于好例子网
本站旨在为广大IT学习爱好者提供一个非营利性互相学习交流分享平台。本站所有资源都可以被免费获取学习研究。本站资源来自网友分享,对搜索内容的合法性不具有预见性、识别性、控制性,仅供学习研究,请务必在下载后24小时内给予删除,不得用于其他任何用途,否则后果自负。基于互联网的特殊性,平台无法对用户传输的作品、信息、内容的权属或合法性、安全性、合规性、真实性、科学性、完整权、有效性等进行实质审查;无论平台是否已进行审查,用户均应自行承担因其传输的作品、信息、内容而可能或已经产生的侵权或权属纠纷等法律责任。本站所有资源不代表本站的观点或立场,基于网友分享,根据中国法律《信息网络传播权保护条例》第二十二与二十三条之规定,若资源存在侵权或相关问题请联系本站客服人员,点此联系我们。关于更多版权及免责申明参见 版权及免责申明


网友评论
我要评论