
实例介绍
【实例简介】Systems.Performance.Enterprise.and.the.Cloud.2nd.Edition.
【实例截图】


【核心代码】
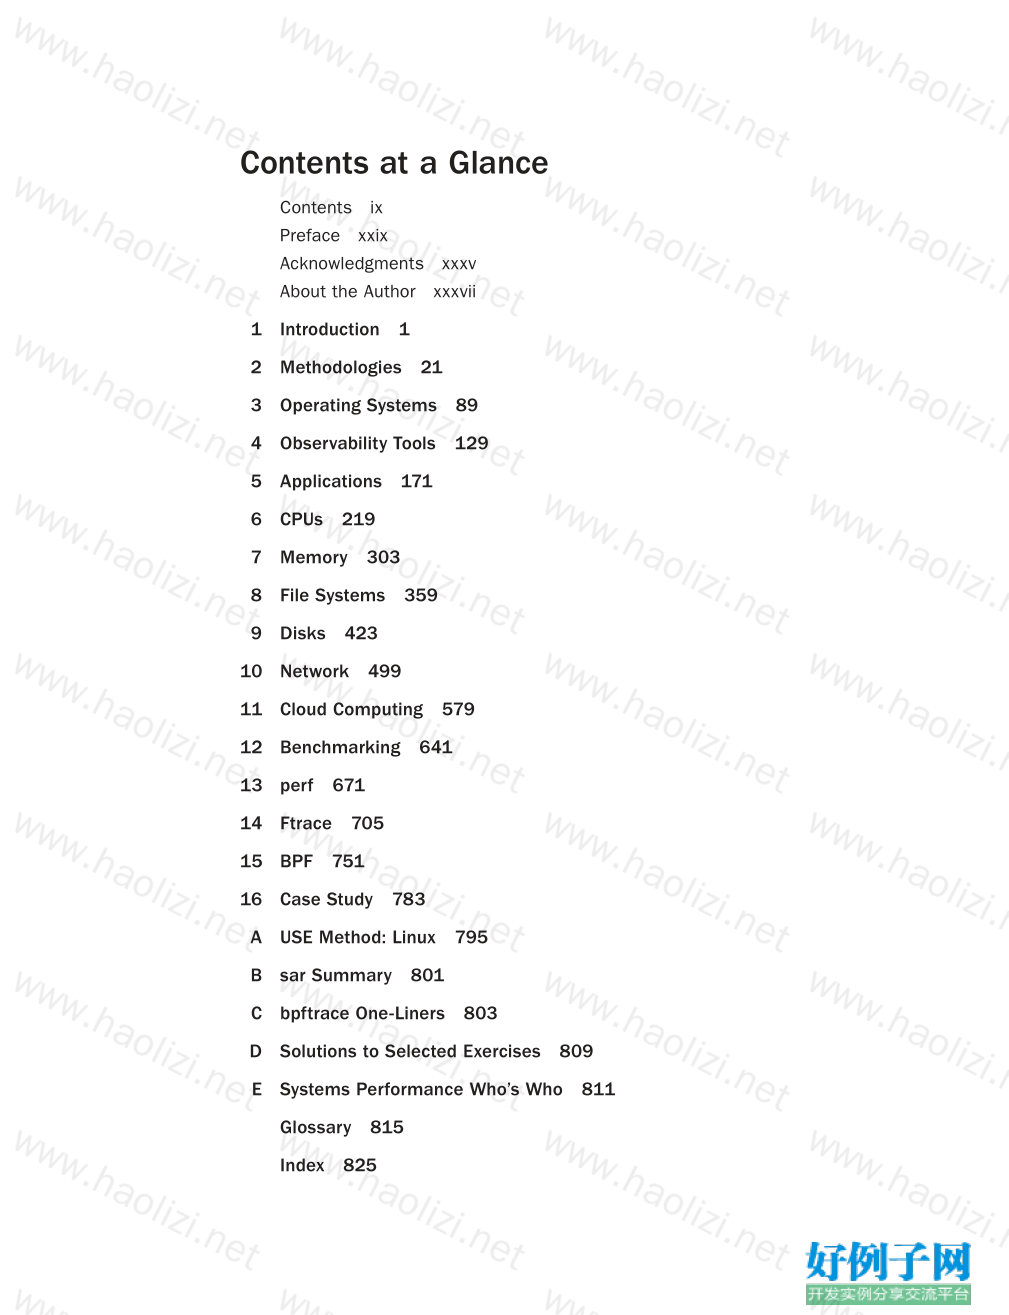
Contents at a Glance
Contents ix
Preface xxix
Acknowledgments xxxv
About the Author xxxvii
1 Introduction 1
2 Methodologies 21
3 Operating Systems 89
4 Observability Tools 129
5 Applications 171
6 CPUs 219
7 Memory 303
8 File Systems 359
9 Disks 423
10 Network 499
11 Cloud Computing 579
12 Benchmarking 641
13 perf 671
14 Ftrace 705
15 BPF 751
16 Case Study 783
A USE Method: Linux 795
B sar Summary 801
C bpftrace One-Liners 803
D Solutions to Selected Exercises 809
E Systems Performance Who’s Who 811
Glossary 815
Index 825This page intentionally left blank Contents
Preface xxix
Acknowledgments xxxv
About the Author xxxvii
1 Introduction 1
1.1 Systems Performance 1
1.2 Roles 2
1.3 Activities 3
1.4 Perspectives 4
1.5 Performance Is Challenging 5
1.5.1 Subjectivity 5
1.5.2 Complexity 5
1.5.3 Multiple Causes 6
1.5.4 Multiple Performance Issues 6
1.6 Latency 6
1.7 Observability 7
1.7.1 Counters, Statistics, and Metrics 8
1.7.2 Profiling 10
1.7.3 Tracing 11
1.8 Experimentation 13
1.9 Cloud Computing 14
1.10 Methodologies 15
1.10.1 Linux Perf Analysis in 60 Seconds 15
1.11 Case Studies 16
1.11.1 Slow Disks 16
1.11.2 Software Change 18
1.11.3 More Reading 19
1.12 References 19
2 Methodologies 21
2.1 Terminology 22
2.2 Models 23
2.2.1 System Under Test 23
2.2.2 Queueing System 23
2.3 Concepts 24
2.3.1 Latency 24
2.3.2 Time Scales 25x Contents
2.3.3 Trade-Offs 26
2.3.4 Tuning Efforts 27
2.3.5 Level of Appropriateness 28
2.3.6 When to Stop Analysis 29
2.3.7 Point-in-Time Recommendations 29
2.3.8 Load vs. Architecture 30
2.3.9 Scalability 31
2.3.10 Metrics 32
2.3.11 Utilization 33
2.3.12 Saturation 34
2.3.13 Profiling 35
2.3.14 Caching 35
2.3.15 Known-Unknowns 37
2.4 Perspectives 37
2.4.1 Resource Analysis 38
2.4.2 Workload Analysis 39
2.5 Methodology 40
2.5.1 Streetlight Anti-Method 42
2.5.2 Random Change Anti-Method 42
2.5.3 Blame-Someone-Else Anti-Method 43
2.5.4 Ad Hoc Checklist Method 43
2.5.5 Problem Statement 44
2.5.6 Scientific Method 44
2.5.7 Diagnosis Cycle 46
2.5.8 Tools Method 46
2.5.9 The USE Method 47
2.5.10 The RED Method 53
2.5.11 Workload Characterization 54
2.5.12 Drill-Down Analysis 55
2.5.13 Latency Analysis 56
2.5.14 Method R 57
2.5.15 Event Tracing 57
2.5.16 Baseline Statistics 59
2.5.17 Static Performance Tuning 59
2.5.18 Cache Tuning 60
2.5.19 Micro-Benchmarking 60
2.5.20 Performance Mantras 61Contents
xi
2.6 Modeling 62
2.6.1 Enterprise vs. Cloud 62
2.6.2 Visual Identification 62
2.6.3 Amdahl’s Law of Scalability 64
2.6.4 Universal Scalability Law 65
2.6.5 Queueing Theory 66
2.7 Capacity Planning 69
2.7.1 Resource Limits 70
2.7.2 Factor Analysis 71
2.7.3 Scaling Solutions 72
2.8 Statistics 73
2.8.1 Quantifying Performance Gains 73
2.8.2 Averages 74
2.8.3 Standard Deviation, Percentiles, Median 75
2.8.4 Coefficient of Variation 76
2.8.5 Multimodal Distributions 76
2.8.6 Outliers 77
2.9 Monitoring 77
2.9.1 Time-Based Patterns 77
2.9.2 Monitoring Products 79
2.9.3 Summary-Since-Boot 79
2.10 Visualizations 79
2.10.1 Line Chart 80
2.10.2 Scatter Plots 81
2.10.3 Heat Maps 82
2.10.4 Timeline Charts 83
2.10.5 Surface Plot 84
2.10.6 Visualization Tools 85
2.11 Exercises 85
2.12 References 86
3 Operating Systems 89
3.1 Terminology 90
3.2 Background 91
3.2.1 Kernel 91
3.2.2 Kernel and User Modes 93
3.2.3 System Calls 94xii Contents
3.2.4 Interrupts 96
3.2.5 Clock and Idle 99
3.2.6 Processes 99
3.2.7 Stacks 102
3.2.8 Virtual Memory 104
3.2.9 Schedulers 105
3.2.10 File Systems 106
3.2.11 Caching 108
3.2.12 Networking 109
3.2.13 Device Drivers 109
3.2.14 Multiprocessor 110
3.2.15 Preemption 110
3.2.16 Resource Management 110
3.2.17 Observability 111
3.3 Kernels 111
3.3.1 Unix 112
3.3.2 BSD 113
3.3.3 Solaris 114
3.4 Linux 114
3.4.1 Linux Kernel Developments 115
3.4.2 systemd 120
3.4.3 KPTI (Meltdown) 121
3.4.4 Extended BPF 121
3.5 Other Topics 122
3.5.1 PGO Kernels 122
3.5.2 Unikernels 123
3.5.3 Microkernels and Hybrid Kernels 123
3.5.4 Distributed Operating Systems 123
3.6 Kernel Comparisons 124
3.7 Exercises 124
3.8 References 125
3.8.1 Additional Reading 127
4 Observability Tools 129
4.1 Tool Coverage 130
4.1.1 Static Performance Tools 130
4.1.2 Crisis Tools 131Contents
xiii
4.2 Tool Types 133
4.2.1 Fixed Counters 133
4.2.2 Profiling 135
4.2.3 Tracing 136
4.2.4 Monitoring 137
4.3 Observability Sources 138
4.3.1 /proc 140
4.3.2 /sys 143
4.3.3 Delay Accounting 145
4.3.4 netlink 145
4.3.5 Tracepoints 146
4.3.6 kprobes 151
4.3.7 uprobes 153
4.3.8 USDT 155
4.3.9 Hardware Counters (PMCs) 156
4.3.10 Other Observability Sources 159
4.4 sar 160
4.4.1 sar(1) Coverage 161
4.4.2 sar(1) Monitoring 161
4.4.3 sar(1) Live 165
4.4.4 sar(1) Documentation 165
4.5 Tracing Tools 166
4.6 Observing Observability 167
4.7 Exercises 168
4.8 References 168
5 Applications 171
5.1 Application Basics 172
5.1.1 Objectives 173
5.1.2 Optimize the Common Case 174
5.1.3 Observability 174
5.1.4 Big O Notation 175
5.2 Application Performance Techniques 176
5.2.1 Selecting an I/O Size 176
5.2.2 Caching 176
5.2.3 Buffering 177
5.2.4 Polling 177
5.2.5 Concurrency and Parallelism 177xiv Contents
5.2.6 Non-Blocking I/O 181
5.2.7 Processor Binding 181
5.2.8 Performance Mantras 182
5.3 Programming Languages 182
5.3.1 Compiled Languages 183
5.3.2 Interpreted Languages 184
5.3.3 Virtual Machines 185
5.3.4 Garbage Collection 185
5.4 Methodology 186
5.4.1 CPU Profiling 187
5.4.2 Off-CPU Analysis 189
5.4.3 Syscall Analysis 192
5.4.4 USE Method 193
5.4.5 Thread State Analysis 193
5.4.6 Lock Analysis 198
5.4.7 Static Performance Tuning 198
5.4.8 Distributed Tracing 199
5.5 Observability Tools 199
5.5.1 perf 200
5.5.2 profile 203
5.5.3 offcputime 204
5.5.4 strace 205
5.5.5 execsnoop 207
5.5.6 syscount 208
5.5.7 bpftrace 209
5.6 Gotchas 213
5.6.1 Missing Symbols 214
5.6.2 Missing Stacks 215
5.7 Exercises 216
5.8 References 217
6 CPUs 219
6.1 Terminology 220
6.2 Models 221
6.2.1 CPU Architecture 221
6.2.2 CPU Memory Caches 221
6.2.3 CPU Run Queues 222Contents
xv
6.3 Concepts 223
6.3.1 Clock Rate 223
6.3.2 Instructions 223
6.3.3 Instruction Pipeline 224
6.3.4 Instruction Width 224
6.3.5 Instruction Size 224
6.3.6 SMT 225
6.3.7 IPC, CPI 225
6.3.8 Utilization 226
6.3.9 User Time/Kernel Time 226
6.3.10 Saturation 226
6.3.11 Preemption 227
6.3.12 Priority Inversion 227
6.3.13 Multiprocess, Multithreading 227
6.3.14 Word Size 229
6.3.15 Compiler Optimization 229
6.4 Architecture 229
6.4.1 Hardware 230
6.4.2 Software 241
6.5 Methodology 244
6.5.1 Tools Method 245
6.5.2 USE Method 245
6.5.3 Workload Characterization 246
6.5.4 Profiling 247
6.5.5 Cycle Analysis 251
6.5.6 Performance Monitoring 251
6.5.7 Static Performance Tuning 252
6.5.8 Priority Tuning 252
6.5.9 Resource Controls 253
6.5.10 CPU Binding 253
6.5.11 Micro-Benchmarking 253
6.6 Observability Tools 254
6.6.1 uptime 255
6.6.2 vmstat 258
6.6.3 mpstat 259
6.6.4 sar 260
6.6.5 ps 260xvi Contents
6.6.6 top 261
6.6.7 pidstat 262
6.6.8 time, ptime 263
6.6.9 turbostat 264
6.6.10 showboost 265
6.6.11 pmcarch 265
6.6.12 tlbstat 266
6.6.13 perf 267
6.6.14 profile 277
6.6.15 cpudist 278
6.6.16 runqlat 279
6.6.17 runqlen 280
6.6.18 softirqs 281
6.6.19 hardirqs 282
6.6.20 bpftrace 282
6.6.21 Other Tools 285
6.7 Visualizations 288
6.7.1 Utilization Heat Map 288
6.7.2 Subsecond-Offset Heat Map 289
6.7.3 Flame Graphs 289
6.7.4 FlameScope 292
6.8 Experimentation 293
6.8.1 Ad Hoc 293
6.8.2 SysBench 294
6.9 Tuning 294
6.9.1 Compiler Options 295
6.9.2 Scheduling Priority and Class 295
6.9.3 Scheduler Options 295
6.9.4 Scaling Governors 297
6.9.5 Power States 297
6.9.6 CPU Binding 297
6.9.7 Exclusive CPU Sets 298
6.9.8 Resource Controls 298
6.9.9 Security Boot Options 298
6.9.10 Processor Options (BIOS Tuning) 299
6.10 Exercises 299
6.11 References 300Contents
xvii
7 Memory 303
7.1 Terminology 304
7.2 Concepts 305
7.2.1 Virtual Memory 305
7.2.2 Paging 306
7.2.3 Demand Paging 307
7.2.4 Overcommit 308
7.2.5 Process Swapping 308
7.2.6 File System Cache Usage 309
7.2.7 Utilization and Saturation 309
7.2.8 Allocators 309
7.2.9 Shared Memory 310
7.2.10 Working Set Size 310
7.2.11 Word Size 310
7.3 Architecture 311
7.3.1 Hardware 311
7.3.2 Software 315
7.3.3 Process Virtual Address Space 319
7.4 Methodology 323
7.4.1 Tools Method 323
7.4.2 USE Method 324
7.4.3 Characterizing Usage 325
7.4.4 Cycle Analysis 326
7.4.5 Performance Monitoring 326
7.4.6 Leak Detection 326
7.4.7 Static Performance Tuning 327
7.4.8 Resource Controls 328
7.4.9 Micro-Benchmarking 328
7.4.10 Memory Shrinking 328
7.5 Observability Tools 328
7.5.1 vmstat 329
7.5.2 PSI 330
7.5.3 swapon 331
7.5.4 sar 331
7.5.5 slabtop 333
7.5.6 numastat 334
7.5.7 ps 335
7.5.8 top 336xviii Contents
7.5.9 pmap 337
7.5.10 perf 338
7.5.11 drsnoop 342
7.5.12 wss 342
7.5.13 bpftrace 343
7.5.14 Other Tools 347
7.6 Tuning 350
7.6.1 Tunable Parameters 350
7.6.2 Multiple Page Sizes 352
7.6.3 Allocators 353
7.6.4 NUMA Binding 353
7.6.5 Resource Controls 353
7.7 Exercises 354
7.8 References 355
8 File Systems 359
8.1 Terminology 360
8.2 Models 361
8.2.1 File System Interfaces 361
8.2.2 File System Cache 361
8.2.3 Second-Level Cache 362
8.3 Concepts 362
8.3.1 File System Latency 362
8.3.2 Caching 363
8.3.3 Random vs. Sequential I/O 363
8.3.4 Prefetch 364
8.3.5 Read-Ahead 365
8.3.6 Write-Back Caching 365
8.3.7 Synchronous Writes 366
8.3.8 Raw and Direct I/O 366
8.3.9 Non-Blocking I/O 366
8.3.10 Memory-Mapped Files 367
8.3.11 Metadata 367
8.3.12 Logical vs. Physical I/O 368
8.3.13 Operations Are Not Equal 370
8.3.14 Special File Systems 371
8.3.15 Access Timestamps 371
8.3.16 Capacity 371Contents
xix
8.4 Architecture 372
8.4.1 File System I/O Stack 372
8.4.2 VFS 373
8.4.3 File System Caches 373
8.4.4 File System Features 375
8.4.5 File System Types 377
8.4.6 Volumes and Pools 382
8.5 Methodology 383
8.5.1 Disk Analysis 384
8.5.2 Latency Analysis 384
8.5.3 Workload Characterization 386
8.5.4 Performance Monitoring 388
8.5.5 Static Performance Tuning 389
8.5.6 Cache Tuning 389
8.5.7 Workload Separation 389
8.5.8 Micro-Benchmarking 390
8.6 Observability Tools 391
8.6.1 mount 392
8.6.2 free 392
8.6.3 top 393
8.6.4 vmstat 393
8.6.5 sar 393
8.6.6 slabtop 394
8.6.7 strace 395
8.6.8 fatrace 395
8.6.9 LatencyTOP 396
8.6.10 opensnoop 397
8.6.11 filetop 398
8.6.12 cachestat 399
8.6.13 ext4dist (xfs, zfs, btrfs, nfs) 399
8.6.14 ext4slower (xfs, zfs, btrfs, nfs) 401
8.6.15 bpftrace 402
8.6.17 Other Tools 409
8.6.18 Visualizations 410
8.7 Experimentation 411
8.7.1 Ad Hoc 411
8.7.2 Micro-Benchmark Tools 412
8.7.3 Cache Flushing 414xx Contents
8.8 Tuning 414
8.8.1 Application Calls 415
8.8.2 ext4 416
8.8.3 ZFS 418
8.9 Exercises 419
8.10 References 420
9 Disks 423
9.1 Terminology 424
9.2 Models 425
9.2.1 Simple Disk 425
9.2.2 Caching Disk 425
9.2.3 Controller 426
9.3 Concepts 427
9.3.1 Measuring Time 427
9.3.2 Time Scales 429
9.3.3 Caching 430
9.3.4 Random vs. Sequential I/O 430
9.3.5 Read/Write Ratio 431
9.3.6 I/O Size 432
9.3.7 IOPS Are Not Equal 432
9.3.8 Non-Data-Transfer Disk Commands 432
9.3.9 Utilization 433
9.3.10 Saturation 434
9.3.11 I/O Wait 434
9.3.12 Synchronous vs. Asynchronous 434
9.3.13 Disk vs. Application I/O 435
9.4 Architecture 435
9.4.1 Disk Types 435
9.4.2 Interfaces 442
9.4.3 Storage Types 443
9.4.4 Operating System Disk I/O Stack 446
9.5 Methodology 449
9.5.1 Tools Method 450
9.5.2 USE Method 450
9.5.3 Performance Monitoring 452
9.5.4 Workload Characterization 452
9.5.5 Latency Analysis 454Contents
xxi
9.5.6 Static Performance Tuning 455
9.5.7 Cache Tuning 456
9.5.8 Resource Controls 456
9.5.9 Micro-Benchmarking 456
9.5.10 Scaling 457
9.6 Observability Tools 458
9.6.1 iostat 459
9.6.2 sar 463
9.6.3 PSI 464
9.6.4 pidstat 464
9.6.5 perf 465
9.6.6 biolatency 468
9.6.7 biosnoop 470
9.6.8 iotop, biotop 472
9.6.9 biostacks 474
9.6.10 blktrace 475
9.6.11 bpftrace 479
9.6.12 MegaCli 484
9.6.13 smartctl 484
9.6.14 SCSI Logging 486
9.6.15 Other Tools 487
9.7 Visualizations 487
9.7.1 Line Graphs 487
9.7.2 Latency Scatter Plots 488
9.7.3 Latency Heat Maps 488
9.7.4 Offset Heat Maps 489
9.7.5 Utilization Heat Maps 490
9.8 Experimentation 490
9.8.1 Ad Hoc 490
9.8.2 Custom Load Generators 491
9.8.3 Micro-Benchmark Tools 491
9.8.4 Random Read Example 491
9.8.5 ioping 492
9.8.6 fio 493
9.8.7 blkreplay 493
9.9 Tuning 493
9.9.1 Operating System Tunables 493xxii Contents
9.9.2 Disk Device Tunables 494
9.9.3 Disk Controller Tunables 494
9.10 Exercises 495
9.11 References 496
10 Network 499
10.1 Terminology 500
10.2 Models 501
10.2.1 Network Interface 501
10.2.2 Controller 501
10.2.3 Protocol Stack 502
10.3 Concepts 503
10.3.1 Networks and Routing 503
10.3.2 Protocols 504
10.3.3 Encapsulation 504
10.3.4 Packet Size 504
10.3.5 Latency 505
10.3.6 Buffering 507
10.3.7 Connection Backlog 507
10.3.8 Interface Negotiation 508
10.3.9 Congestion Avoidance 508
10.3.10 Utilization 508
10.3.11 Local Connections 509
10.4 Architecture 509
10.4.1 Protocols 509
10.4.2 Hardware 515
10.4.3 Software 517
10.5 Methodology 524
10.5.1 Tools Method 525
10.5.2 USE Method 526
10.5.3 Workload Characterization 527
10.5.4 Latency Analysis 528
10.5.5 Performance Monitoring 529
10.5.6 Packet Sniffing 530
10.5.7 TCP Analysis 531
10.5.8 Static Performance Tuning 531
10.5.9 Resource Controls 532
10.5.10 Micro-Benchmarking 533Contents
xxiii
10.6 Observability Tools 533
10.6.1 ss 534
10.6.2 ip 536
10.6.3 ifconfig 537
10.6.4 nstat 538
10.6.5 netstat 539
10.6.6 sar 543
10.6.7 nicstat 545
10.6.8 ethtool 546
10.6.9 tcplife 548
10.6.10 tcptop 549
10.6.11 tcpretrans 549
10.6.12 bpftrace 550
10.6.13 tcpdump 558
10.6.14 Wireshark 560
10.6.15 Other Tools 560
10.7 Experimentation 562
10.7.1 ping 562
10.7.2 traceroute 563
10.7.3 pathchar 564
10.7.4 iperf 564
10.7.5 netperf 565
10.7.6 tc 566
10.7.7 Other Tools 567
10.8 Tuning 567
10.8.1 System-Wide 567
10.8.2 Socket Options 573
10.8.3 Configuration 574
10.9 Exercises 574
10.10 References 575
11 Cloud Computing 579
11.1 Background 580
11.1.1 Instance Types 581
11.1.2 Scalable Architecture 581
11.1.3 Capacity Planning 582
11.1.4 Storage 584
11.1.5 Multitenancy 585
11.1.6 Orchestration (Kubernetes) 586xxiv Contents
11.2 Hardware Virtualization 587
11.2.1 Implementation 588
11.2.2 Overhead 589
11.2.3 Resource Controls 595
11.2.4 Observability 597
11.3 OS Virtualization 605
11.3.1 Implementation 607
11.3.2 Overhead 610
11.3.3 Resource Controls 613
11.3.4 Observability 617
11.4 Lightweight Virtualization 630
11.4.1 Implementation 631
11.4.2 Overhead 632
11.4.3 Resource Controls 632
11.4.4 Observability 632
11.5 Other Types 634
11.6 Comparisons 634
11.7 Exercises 636
11.8 References 637
12 Benchmarking 641
12.1 Background 642
12.1.1 Reasons 642
12.1.2 Effective Benchmarking 643
12.1.3 Benchmarking Failures 645
12.2 Benchmarking Types 651
12.2.1 Micro-Benchmarking 651
12.2.2 Simulation 653
12.2.3 Replay 654
12.2.4 Industry Standards 654
12.3 Methodology 656
12.3.1 Passive Benchmarking 656
12.3.2 Active Benchmarking 657
12.3.3 CPU Profiling 660
12.3.4 USE Method 661
12.3.5 Workload Characterization 662
12.3.6 Custom Benchmarks 662
12.3.7 Ramping Load 662Contents
xxv
12.3.8 Sanity Check 664
12.3.9 Statistical Analysis 665
12.3.10 Benchmarking Checklist 666
12.4 Benchmark Questions 667
12.5 Exercises 668
12.6 References 669
13 perf 671
13.1 Subcommands Overview 672
13.2 One-Liners 674
13.3 perf Events 679
13.4 Hardware Events 681
13.4.1 Frequency Sampling 682
13.5 Software Events 683
13.6 Tracepoint Events 684
13.7 Probe Events 685
13.7.1 kprobes 685
13.7.2 uprobes 687
13.7.3 USDT 690
13.8 perf stat 691
13.8.1 Options 692
13.8.2 Interval Statistics 693
13.8.3 Per-CPU Balance 693
13.8.4 Event Filters 693
13.8.5 Shadow Statistics 694
13.9 perf record 694
13.9.1 Options 695
13.9.2 CPU Profiling 695
13.9.3 Stack Walking 696
13.10 perf report 696
13.10.1 TUI 697
13.10.2 STDIO 697
13.11 perf script 698
13.11.1 Flame Graphs 700
13.11.2 Trace Scripts 700
13.12 perf trace 701
13.12.1 Kernel Versions 702
13.13 Other Commands 702xxvi Contents
13.14 perf Documentation 703
13.15 References 703
14 Ftrace 705
14.1 Capabilities Overview 706
14.2 tracefs (/sys) 708
14.2.1 tracefs Contents 709
14.3 Ftrace Function Profiler 711
14.4 Ftrace Function Tracing 713
14.4.1 Using trace 713
14.4.2 Using trace_pipe 715
14.4.3 Options 716
14.5 Tracepoints 717
14.5.1 Filter 717
14.5.2 Trigger 718
14.6 kprobes 719
14.6.1 Event Tracing 719
14.6.2 Arguments 720
14.6.3 Return Values 721
14.6.4 Filters and Triggers 721
14.6.5 kprobe Profiling 722
14.7 uprobes 722
14.7.1 Event Tracing 722
14.7.2 Arguments and Return Values 723
14.7.3 Filters and Triggers 723
14.7.4 uprobe Profiling 723
14.8 Ftrace function_graph 724
14.8.1 Graph Tracing 724
14.8.2 Options 725
14.9 Ftrace hwlat 726
14.10 Ftrace Hist Triggers 727
14.10.1 Single Keys 727
14.10.2 Fields 728
14.10.3 Modifiers 729
14.10.4 PID Filters 729
14.10.5 Multiple Keys 730
14.10.6 Stack Trace Keys 730
14.10.7 Synthetic Events 731Contents
xxvii
14.11 trace-cmd 734
14.11.1 Subcommands Overview 734
14.11.2 trace-cmd One-Liners 736
14.11.3 trace-cmd vs. perf(1) 738
14.11.4 trace-cmd function_graph 739
14.11.5 KernelShark 739
14.11.6 trace-cmd Documentation 740
14.12 perf ftrace 741
14.13 perf-tools 741
14.13.1 Tool Coverage 742
14.13.2 Single-Purpose Tools 743
14.13.3 Multi-Purpose Tools 744
14.13.4 perf-tools One-Liners 745
14.13.5 Example 747
14.13.6 perf-tools vs. BCC/BPF 747
14.13.7 Documentation 748
14.14 Ftrace Documentation 748
14.15 References 749
15 BPF 751
15.1 BCC 753
15.1.1 Installation 754
15.1.2 Tool Coverage 754
15.1.3 Single-Purpose Tools 755
15.1.4 Multi-Purpose Tools 757
15.1.5 One-Liners 757
15.1.6 Multi-Tool Example 759
15.1.7 BCC vs. bpftrace 760
15.1.8 Documentation 760
15.2 bpftrace 761
15.2.1 Installation 762
15.2.2 Tools 762
15.2.3 One-Liners 763
15.2.4 Programming 766
15.2.5 Reference 774
15.2.6 Documentation 781
15.3 References 782xxviii Contents
16 Case Study 783
16.1 An Unexplained Win 783
16.1.1 Problem Statement 783
16.1.2 Analysis Strategy 784
16.1.3 Statistics 784
16.1.4 Configuration 786
16.1.5 PMCs 788
16.1.6 Software Events 789
16.1.7 Tracing 790
16.1.8 Conclusion 792
16.2 Additional Information 792
16.3 References 793
A USE Method: Linux 795
B sar Summary 801
C bpftrace One-Liners 803
D Solutions to Selected Exercises 809
E Systems Performance Who’s Who 811
Glossary 815
Index 825
好例子网口号:伸出你的我的手 — 分享!
小贴士
感谢您为本站写下的评论,您的评论对其它用户来说具有重要的参考价值,所以请认真填写。
- 类似“顶”、“沙发”之类没有营养的文字,对勤劳贡献的楼主来说是令人沮丧的反馈信息。
- 相信您也不想看到一排文字/表情墙,所以请不要反馈意义不大的重复字符,也请尽量不要纯表情的回复。
- 提问之前请再仔细看一遍楼主的说明,或许是您遗漏了。
- 请勿到处挖坑绊人、招贴广告。既占空间让人厌烦,又没人会搭理,于人于己都无利。
关于好例子网
本站旨在为广大IT学习爱好者提供一个非营利性互相学习交流分享平台。本站所有资源都可以被免费获取学习研究。本站资源来自网友分享,对搜索内容的合法性不具有预见性、识别性、控制性,仅供学习研究,请务必在下载后24小时内给予删除,不得用于其他任何用途,否则后果自负。基于互联网的特殊性,平台无法对用户传输的作品、信息、内容的权属或合法性、安全性、合规性、真实性、科学性、完整权、有效性等进行实质审查;无论平台是否已进行审查,用户均应自行承担因其传输的作品、信息、内容而可能或已经产生的侵权或权属纠纷等法律责任。本站所有资源不代表本站的观点或立场,基于网友分享,根据中国法律《信息网络传播权保护条例》第二十二与二十三条之规定,若资源存在侵权或相关问题请联系本站客服人员,点此联系我们。关于更多版权及免责申明参见 版权及免责申明

网友评论
我要评论