
实例介绍
【实例简介】QCustomPlot游标绘图
【实例截图】Qt动态实时绘图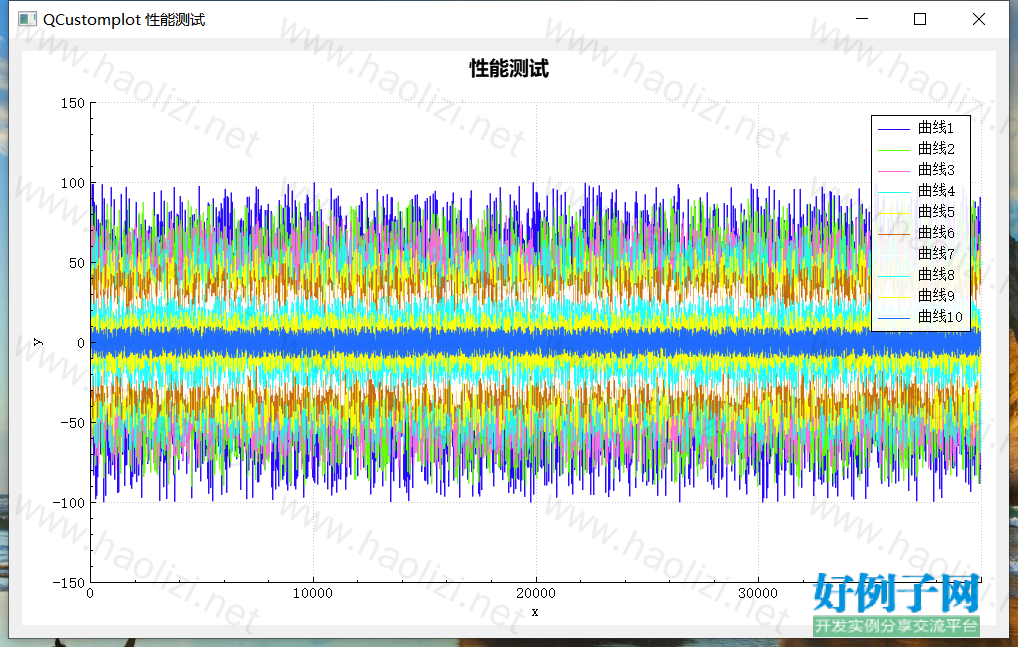
【核心代码】LDrawSpectrum::LDrawSpectrum(QWidget *parent)
: QWidget(parent)
{
Qt::WindowFlags flags = Qt::Dialog;
flags |= Qt::WindowMinMaxButtonsHint;
flags |= Qt::WindowCloseButtonHint;
setWindowFlags(flags);
setWindowTitle("QCustomplot " strName);
m_customPlot = new LXCustomPlot();
m_customPlot->showTracer(true);
// add title layout element:
m_customPlot->plotLayout()->insertRow(0);
m_customPlot->plotLayout()->addElement(0, 0, new QCPTextElement(m_customPlot, strName " (10条动态曲线)", QFont("微软雅黑", 12, QFont::Bold)));
m_customPlot->legend->setVisible(true);
QFont legendFont = font(); // start out with MainWindow's font..
legendFont.setPointSize(9); // and make a bit smaller for legend
m_customPlot->legend->setFont(legendFont);
m_customPlot->legend->setBrush(QBrush(QColor(255, 255, 255, 230)));
// by default, the legend is in the inset layout of the main axis rect. So this is how we access it to change legend placement:
m_customPlot->axisRect()->insetLayout()->setInsetAlignment(0, Qt::AlignTop | Qt::AlignRight);
// make left and bottom axes always transfer their ranges to right and top axes:
connect(m_customPlot->xAxis, SIGNAL(rangeChanged(QCPRange)), m_customPlot->xAxis2, SLOT(setRange(QCPRange)));
connect(m_customPlot->yAxis, SIGNAL(rangeChanged(QCPRange)), m_customPlot->yAxis2, SLOT(setRange(QCPRange)));
// Allow user to drag axis ranges with mouse, zoom with mouse wheel and select graphs by clicking:
m_customPlot->setInteractions(QCP::iRangeDrag | QCP::iRangeZoom | QCP::iSelectPlottables);
QList<QColor> colors;
colors << QColor(29, 0, 255) << QColor(100, 255, 0) << QColor(255, 106, 227) << QColor(29, 255, 227) << QColor(255, 255, 0)
<< QColor(200, 106, 20) << QColor(255, 255, 255) << QColor(29, 255, 255) << QColor(255, 255, 0) << QColor(29, 106, 255);
for (auto index = 0; index < colors.size(); index) {
QCPGraph *pGraph = m_customPlot->addGraph();
pGraph->setName(QString("曲线%1").arg(index 1));
pGraph->setPen(QPen(colors[index]));
m_pGraphs.append(pGraph);
}
// give the axes some labels:
m_customPlot->xAxis->setLabel("x");
m_customPlot->yAxis->setLabel("y");
// set axes ranges, so we see all data:
m_customPlot->xAxis->setRange(0, 40000);
m_customPlot->yAxis->setRange(-150, 150);
// m_customPlot->rescaleAxes(true);
m_customPlot->replot();
QVBoxLayout *pLayout = new QVBoxLayout;
pLayout->addWidget(m_customPlot);
setLayout(pLayout);
// showMaximized();
resize(QSize(1000, 600));
connect(&m_pUpdateTimer, SIGNAL(timeout()), this, SLOT(update()));
m_pUpdateTimer.start(5);
}
LDrawSpectrum::~LDrawSpectrum()
{
}
void LDrawSpectrum::update()
{
int nCount = 10000;
QList<QVector<double>> yAlis;
QVector<double> x(nCount), y1(nCount), y2(nCount), y3(nCount), y4(nCount), y5(nCount),
y6(nCount), y7(nCount), y8(nCount), y9(nCount), y10(nCount); // initialize with entries 0..100
yAlis << y1 << y2 << y3 << y4 << y5 << y6 << y7 << y8 << y9 << y10;
for (auto index = 0; index < yAlis.size(); index) {
for (int i = 0; i < nCount; i)
{
x[i] = i*4; // X轴
double data = 0.0;
if (index % 2 == 0) {
data = cos(i);
} else {
data = sin(i);
}
yAlis[index][i] = (qrand() % (100 - index * 10) 1) * data; // Y轴
}
}
for (auto index = 0; index < m_pGraphs.size(); index) {
m_pGraphs[index]->data().data()->clear();
m_pGraphs[index]->addData(x, yAlis[index]);
}
// m_customPlot->replot();
m_customPlot->replot(QCustomPlot::rpQueuedReplot);
}
标签: ST
好例子网口号:伸出你的我的手 — 分享!
相关软件
小贴士
感谢您为本站写下的评论,您的评论对其它用户来说具有重要的参考价值,所以请认真填写。
- 类似“顶”、“沙发”之类没有营养的文字,对勤劳贡献的楼主来说是令人沮丧的反馈信息。
- 相信您也不想看到一排文字/表情墙,所以请不要反馈意义不大的重复字符,也请尽量不要纯表情的回复。
- 提问之前请再仔细看一遍楼主的说明,或许是您遗漏了。
- 请勿到处挖坑绊人、招贴广告。既占空间让人厌烦,又没人会搭理,于人于己都无利。
关于好例子网
本站旨在为广大IT学习爱好者提供一个非营利性互相学习交流分享平台。本站所有资源都可以被免费获取学习研究。本站资源来自网友分享,对搜索内容的合法性不具有预见性、识别性、控制性,仅供学习研究,请务必在下载后24小时内给予删除,不得用于其他任何用途,否则后果自负。基于互联网的特殊性,平台无法对用户传输的作品、信息、内容的权属或合法性、安全性、合规性、真实性、科学性、完整权、有效性等进行实质审查;无论平台是否已进行审查,用户均应自行承担因其传输的作品、信息、内容而可能或已经产生的侵权或权属纠纷等法律责任。本站所有资源不代表本站的观点或立场,基于网友分享,根据中国法律《信息网络传播权保护条例》第二十二与二十三条之规定,若资源存在侵权或相关问题请联系本站客服人员,点此联系我们。关于更多版权及免责申明参见 版权及免责申明

网友评论
我要评论