

实例介绍
【实例简介】QCustomPlot动态绘图,解决CPU占用内存高问题
【实例截图】Qt动态实时绘图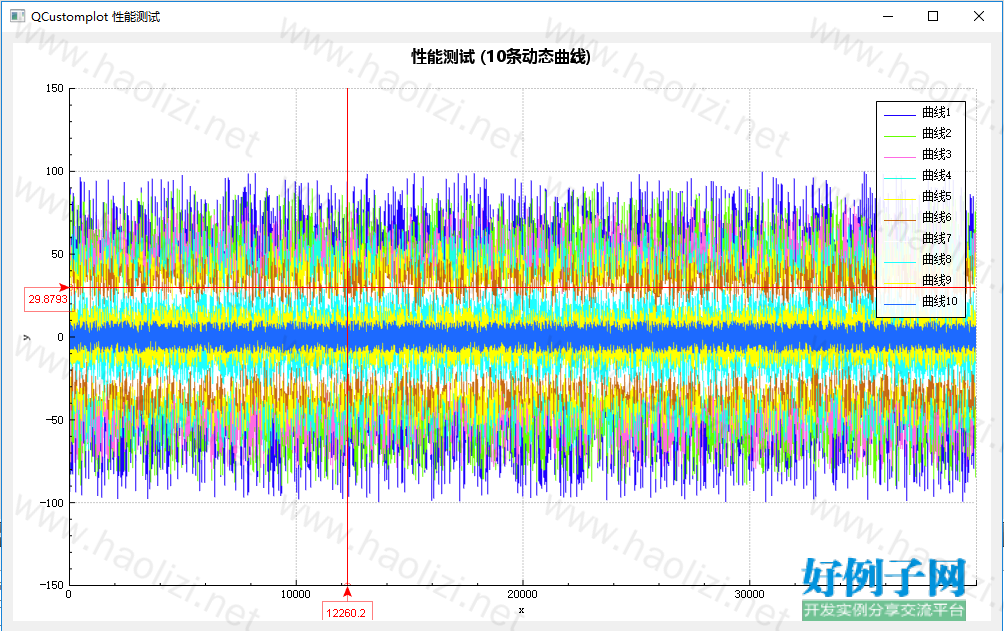
【核心代码】
【实例截图】Qt动态实时绘图
【核心代码】
LXTracer::LXTracer(QCustomPlot *_plot, TracerType _type, QObject *parent)
    : QObject(parent),
      m_plot(_plot),
      m_type(_type)
{
    m_visible = true;
    m_tracer = Q_NULLPTR;// 跟踪的点
    m_label = Q_NULLPTR;// 显示的数值
    m_arrow = Q_NULLPTR;// 箭头
    if (m_plot)
    {
        QColor clrDefault(Qt::red);
        QBrush brushDefault(Qt::NoBrush);
        QPen penDefault(clrDefault);
        //        penDefault.setBrush(brushDefault);
        penDefault.setWidthF(0.5);

        m_tracer = new QCPItemTracer(m_plot);
        m_tracer->setStyle(QCPItemTracer::tsCircle);
        m_tracer->setPen(penDefault);
        m_tracer->setBrush(brushDefault);

        m_label = new QCPItemText(m_plot);
        m_label->setLayer("overlay");
        m_label->setClipToAxisRect(false);
        m_label->setPadding(QMargins(5, 5, 5, 5));
        m_label->setBrush(brushDefault);
        m_label->setPen(penDefault);
        m_label->position->setParentAnchor(m_tracer->position);
//        m_label->setFont(QFont("宋体", 8));
        m_label->setFont(QFont("Arial", 8));
        m_label->setColor(clrDefault);
        m_label->setText("");

        m_arrow = new QCPItemLine(m_plot);
        QPen  arrowPen(clrDefault, 1);
        m_arrow->setPen(penDefault);
        m_arrow->setLayer("overlay");
        m_arrow->setClipToAxisRect(false);
        m_arrow->setHead(QCPLineEnding::esSpikeArrow);//设置头部为箭头形状

        switch (m_type)
        {
            case XAxisTracer:
                {
                    m_tracer->position->setTypeX(QCPItemPosition::ptPlotCoords);
                    m_tracer->position->setTypeY(QCPItemPosition::ptAxisRectRatio);
                    m_tracer->setSize(7);
                    m_label->setPositionAlignment(Qt::AlignTop | Qt::AlignHCenter);

                    m_arrow->end->setParentAnchor(m_tracer->position);
                    m_arrow->start->setParentAnchor(m_arrow->end);
                    m_arrow->start->setCoords(0, 20);//偏移量
                    break;
                }
            case YAxisTracer:
                {
                    m_tracer->position->setTypeX(QCPItemPosition::ptAxisRectRatio);
                    m_tracer->position->setTypeY(QCPItemPosition::ptPlotCoords);
                    m_tracer->setSize(7);
                    m_label->setPositionAlignment(Qt::AlignRight | Qt::AlignHCenter);

                    m_arrow->end->setParentAnchor(m_tracer->position);
                    m_arrow->start->setParentAnchor(m_label->position);
                    m_arrow->start->setCoords(-20, 0);//偏移量
                    break;
                }
            case DataTracer:
                {
                    m_tracer->position->setTypeX(QCPItemPosition::ptPlotCoords);
                    m_tracer->position->setTypeY(QCPItemPosition::ptPlotCoords);
                    m_tracer->setSize(5);

                    m_label->setPositionAlignment(Qt::AlignLeft | Qt::AlignVCenter);

                    m_arrow->end->setParentAnchor(m_tracer->position);
                    m_arrow->start->setParentAnchor(m_arrow->end);
                    m_arrow->start->setCoords(20, 0);
                    break;
                }
            default:
                break;
        }
        setVisible(false);
    }
}

LXTracer::~LXTracer()
{
    if(m_plot)
    {
        if (m_tracer)
        {
            m_plot->removeItem(m_tracer);
        }
        if (m_label)
        {
            m_plot->removeItem(m_label);
        }
        if (m_arrow)
        {
            m_plot->removeItem(m_arrow);
        }
    }
}

void LXTracer::setPen(const QPen &pen)
{
    if(m_tracer)
    {
        m_tracer->setPen(pen);
    }
    if(m_arrow)
    {
        m_arrow->setPen(pen);
    }
}

void LXTracer::setBrush(const QBrush &brush)
{
    if(m_tracer)
    {
        m_tracer->setBrush(brush);
    }
}

void LXTracer::setLabelPen(const QPen &pen)
{
    if(m_label)
    {
        m_label->setPen(pen);
        m_label->setBrush(Qt::NoBrush);
        m_label->setColor(pen.color());
    }
}

void LXTracer::setText(const QString &text)
{
    if(m_label)
    {
        m_label->setText(text);
    }
}

void LXTracer::setVisible(bool vis)
{
    m_visible = vis;
    if(m_tracer)
    {
        m_tracer->setVisible(m_visible);
    }
    if(m_label)
    {
        m_label->setVisible(m_visible);
    }
    if(m_arrow)
    {
        m_arrow->setVisible(m_visible);
    }
}

void LXTracer::updatePosition(double xValue, double yValue)
{
    if (!m_visible)
    {
        setVisible(true);
        m_visible = true;
    }

    if (yValue > m_plot->yAxis->range().upper)
    {
        yValue = m_plot->yAxis->range().upper;
    }

    switch (m_type)
    {
        case XAxisTracer:
            {
                m_tracer->position->setCoords(xValue, 1);
                m_label->position->setCoords(0, 15);
                m_arrow->start->setCoords(0, 15);
                m_arrow->end->setCoords(0, 0);
                setText(QString::number(xValue));
                break;
            }
        case YAxisTracer:
            {
                m_tracer->position->setCoords(0, yValue);
                m_label->position->setCoords(-20, 0);
//        m_arrow->start->setCoords(20, 0);
//        m_arrow->end->setCoords(0, 0);
                setText(QString::number(yValue));
                break;
            }
        case DataTracer:
            {
                m_tracer->position->setCoords(xValue, yValue);
                m_label->position->setCoords(20, 0);
                setText(QString("x:%1,y:%2").arg(xValue).arg(yValue));
                break;
            }
        default:
            break;
    }
}

LXTraceLine::LXTraceLine(QCustomPlot *_plot, LineType _type, QObject *parent)
    : QObject(parent),
      m_type(_type),
      m_plot(_plot)
{
    m_lineV = Q_NULLPTR;
    m_lineH = Q_NULLPTR;
    initLine();
}

LXTraceLine::~LXTraceLine()
{
    if(m_plot)
    {
        if (m_lineV)
        {
            m_plot->removeItem(m_lineV);
        }
        if (m_lineH)
        {
            m_plot->removeItem(m_lineH);
        }
    }
}

void LXTraceLine::initLine()
{
    if(m_plot)
    {
        QPen linesPen(Qt::red, 1, Qt::SolidLine);

        if(VerticalLine == m_type || Both == m_type)
        {
            m_lineV = new QCPItemStraightLine(m_plot);//垂直线
            m_lineV->setLayer("overlay");
            m_lineV->setPen(linesPen);
            m_lineV->setClipToAxisRect(true);
            m_lineV->point1->setCoords(0, 0);
            m_lineV->point2->setCoords(0, 0);
        }

        if(HorizonLine == m_type || Both == m_type)
        {
            m_lineH = new QCPItemStraightLine(m_plot);//水平线
            m_lineH->setLayer("overlay");
            m_lineH->setPen(linesPen);
            m_lineH->setClipToAxisRect(true);
            m_lineH->point1->setCoords(0, 0);
            m_lineH->point2->setCoords(0, 0);
        }
    }
}

void LXTraceLine::updatePosition(double xValue, double yValue)
{
    if(VerticalLine == m_type || Both == m_type)
    {
        if(m_lineV)
        {
            m_lineV->point1->setCoords(xValue, m_plot->yAxis->range().lower);
            m_lineV->point2->setCoords(xValue, m_plot->yAxis->range().upper);
        }
    }

    if(HorizonLine == m_type || Both == m_type)
    {
        if(m_lineH)
        {
            m_lineH->point1->setCoords(m_plot->xAxis->range().lower, yValue);
            m_lineH->point2->setCoords(m_plot->xAxis->range().upper, yValue);
        }
    }
}
标签: Qt
好例子网口号:伸出你的我的手 — 分享!
小贴士
感谢您为本站写下的评论,您的评论对其它用户来说具有重要的参考价值,所以请认真填写。
- 类似“顶”、“沙发”之类没有营养的文字,对勤劳贡献的楼主来说是令人沮丧的反馈信息。
- 相信您也不想看到一排文字/表情墙,所以请不要反馈意义不大的重复字符,也请尽量不要纯表情的回复。
- 提问之前请再仔细看一遍楼主的说明,或许是您遗漏了。
- 请勿到处挖坑绊人、招贴广告。既占空间让人厌烦,又没人会搭理,于人于己都无利。
关于好例子网
本站旨在为广大IT学习爱好者提供一个非营利性互相学习交流分享平台。本站所有资源都可以被免费获取学习研究。本站资源来自网友分享,对搜索内容的合法性不具有预见性、识别性、控制性,仅供学习研究,请务必在下载后24小时内给予删除,不得用于其他任何用途,否则后果自负。基于互联网的特殊性,平台无法对用户传输的作品、信息、内容的权属或合法性、安全性、合规性、真实性、科学性、完整权、有效性等进行实质审查;无论平台是否已进行审查,用户均应自行承担因其传输的作品、信息、内容而可能或已经产生的侵权或权属纠纷等法律责任。本站所有资源不代表本站的观点或立场,基于网友分享,根据中国法律《信息网络传播权保护条例》第二十二与二十三条之规定,若资源存在侵权或相关问题请联系本站客服人员,点此联系我们。关于更多版权及免责申明参见 版权及免责申明

网友评论
我要评论