
实例介绍
【实例简介】
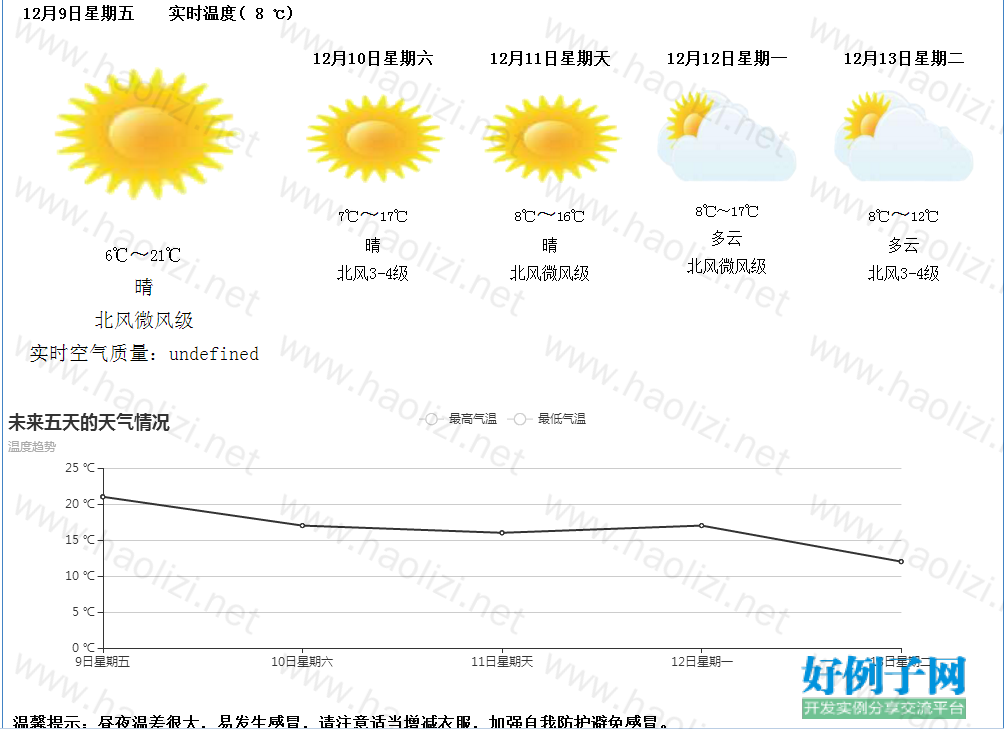
HTML实现天气预报
【实例截图】
【核心代码】
<!DOCTYPE html>
<html>
<meta charset="UTF-8">
<title>天气预报</title>
<link rel="stylesheet" href="./css/test2.css"/>
</head>
<body>
<div class="all">
<div class="header">
<p><label class="diqu"></label></p>
<p><label class="btn">[更多城市]</label></p>
</div>
<!--弹出层(选择城市)-->
<div class="cityBox">
<div class="head">
<span class="title">选择城市</span>
<span class="close" onclick="closeFun()">关闭</span>
</div>
<div class="cont">
<div class="c1">
<label class="bt">省/直辖市:</label>
<ul class="list" id="province"></ul>
</div>
<hr/>
<ul class="list" style="width: 100%;margin-left: 20px" id="city"></ul>
</div>
</div>
<div class="content">
<div class="textTitle">
<span id="date"></span> <span>实时温度(</span>
<span id="wendu"></span>
<span><span style="font-size: 12px">℃</span>)</span>
</div>
<div class="text1">
<div class="tqImg"><img id="img1" src=""/></div>
<div class="xinxi">
<label><span id="low1"></span><span class="dao">~</span><span id="high1"></span></label>
</div>
<div class="xix1" id="type1"></div>
<div class="xix1" id="lixiang1"></div>
<div class="xix1" id="aqi"></div>
</div>
<div class="text2">
<div class="riqi" id="one" ></div>
<div class="tqImg2"><img id="img2" src="" alt=""/></div>
<div class="xinxi2">
<label><span id="low2"></span><span class="dao">~</span><span id="high2"></span></label>
</div>
<div class="xix2" id="type2"></div>
<div class="xix2" id="lixiang2"></div>
</div>
<div class="text2">
<div class="riqi" id="two" ></div>
<div class="tqImg2"><img id="img3" src="" alt=""/></div>
<div class="xinxi2">
<label><span id="low3"></span><span class="dao">~</span><span id="high3"></span></label>
</div>
<div class="xix2" id="type3"></div>
<div class="xix2" id="lixiang3"></div>
</div>
<div class="text2">
<div class="riqi" id="three" ></div>
<div class="tqImg2"><img id="img4" src="" alt=""/></div>
<div class="xinxi2">
<label><span id="low4"></span><span class="dao2">~</span><span id="high4"></span></label>
</div>
<div class="xix2" id="type4"></div>
<div class="xix2" id="lixiang4"></div>
</div>
<div class="text2">
<div class="riqi" id="fore" ></div>
<div class="tqImg2"><img id="img5" src="" alt=""/></div>
<div class="xinxi2">
<label><span id="low5"></span><span class="dao">~</span><span id="high5"></span></label>
</div>
<div class="xix2" id="type5"></div>
<div class="xix2" id="lixiang5"></div>
</div>
<div class="qushitu" id="myChart" style=" width: 998px;height: 300px;"></div>
<label class="tishiyu"> 温馨提示:<span id="tishi"></span></label>
</div>
</div>
<script src="./js/jquery-1.11.2-min.js"></script>
<script src="./js/area.js"></script>
<script src="./js/echarts.js"></script>
<script>
$(function(){
var this_ity;
$.getScript('http://int.dpool.sina.com.cn/iplookup/iplookup.php?format=js', function(_result) {
if (remote_ip_info.ret == '1') {
this_ity=remote_ip_info.city;
var myDate = new Date();
var thisDate=myDate.getMonth() 1;
$.getScript('http://int.dpool.sina.com.cn/iplookup/iplookup.php?format=js', function(_result) {
$.ajax({
type: "GET",
url: "http://wthrcdn.etouch.cn/weather_mini?city=" this_ity,
dataType: "json",
success: function(data){
if(data.status==1000){
var idType=[$("#date"),$("#one"), $("#two"),$("#three"), $("#fore")];
var subzero=[$("#low1"),$("#low2"),$("#low3"),$("#low4"),$("#low5")];
var heat=[$("#high1"),$("#high2"),$("#high3"),$("#high4"),$("#high5")];
var tqtype=[$("#type1"),$("#type2"),$("#type3"),$("#type4"),$("#type5")];
var lixiang=[$("#lixiang1"),$("#lixiang2"),$("#lixiang3"),$("#lixiang4"),$("#lixiang5")];
var date=[];
var fengxiang=[];
var fengli=[];
var high=[];
var high2=[];
var low=[];
var low2=[];
var type=[];
var json=data.data;
$(".diqu").html(json.city);
$("#wendu").html(json.wendu);
$("#tishi").html(json.ganmao);
$("#aqi").html("实时空气质量:" json.aqi);
var forecast=json.forecast;
for(var i=0;i<forecast.length;i ){
date[i]=forecast[i].date;
fengxiang[i]=forecast[i].fengxiang;
fengli[i]=forecast[i].fengli;
high[i]=(forecast[i].high).substring(3,6);
high2[i]=(forecast[i].high).substring(3,5);
low[i]=(forecast[i].low).substring(3,6);
low2[i]=(forecast[i].low).substring(3,5);
type[i]=forecast[i].type;
}
bgFun(type[0]);
for(var j=0;j<forecast.length;j ){
idType[j].html(thisDate "月" date[j]);
subzero[j].html(low[j]);
heat[j].html(high[j]);
tqtype[j].html(type[j]);
lixiang[j].html(fengxiang[j] fengli[j]);
}
typeFun(type[0],img1);
typeFun(type[1],img2);
typeFun(type[2],img3);
typeFun(type[3],img4);
typeFun(type[4],img5);
var myChart = echarts.init(document.getElementById('myChart'));
var option = {
chart: {
backgroundColor: '#f2f2f2',
style: {
fontFamily: "Microsoft YaHei UI",
fontSize: '12px',
fontWeight: 'bold',
color: '#006cee'
}
},
title: {
text: '未来五天的天气情况',
subtext: '温度趋势'
},
tooltip: {
trigger: 'axis'
},
legend: {
data: ['最高气温', '最低气温']
},
toolbox: {
toolbox: {
show: true,
feature: {
dataZoom: {
yAxisIndex: 'none'
},
dataView: {readOnly: false},
magicType: {type: ['line', 'bar']},
restore: {},
saveAsImage: {}
}
}
},
xAxis: [
{
type: 'category',
boundaryGap: false,
data: date
}
],
yAxis: [
{
type: 'value',
axisLabel: {
formatter: '{value} ℃'
}
}
],
series: [
{
type: 'line',
name: '最高气温',
color: '#C90000',
data: high2
},
{
type: 'line',
name: '最低气温',
color: '#239B0E',
data: low2
}
]
};
myChart.setOption(option);
}else{
alert("获取数据错误")
}
}
});
});
// return this_ity
} else {
alert('没有找到匹配的IP地址信息!');
}
});
});
function cityBtn(obj){
closeFun();
var cityS=$(obj).html();
var myDate = new Date();
var thisDate=myDate.getMonth() 1;
$.getScript('http://int.dpool.sina.com.cn/iplookup/iplookup.php?format=js', function(_result) {
$.ajax({
type: "GET",
url: "http://wthrcdn.etouch.cn/weather_mini?city=" cityS,
dataType: "json",
success: function(data){
if(data.status==1000){
var idType=[$("#date"),$("#one"), $("#two"),$("#three"), $("#fore")];
var subzero=[$("#low1"),$("#low2"),$("#low3"),$("#low4"),$("#low5")];
var heat=[$("#high1"),$("#high2"),$("#high3"),$("#high4"),$("#high5")];
var tqtype=[$("#type1"),$("#type2"),$("#type3"),$("#type4"),$("#type5")];
var lixiang=[$("#lixiang1"),$("#lixiang2"),$("#lixiang3"),$("#lixiang4"),$("#lixiang5")];
var date=[];
var fengxiang=[];
var fengli=[];
var high=[];
var high2=[];
var low=[];
var low2=[];
var type=[];
var json=data.data;
$(".diqu").html(json.city);
$("#wendu").html(json.wendu);
$("#tishi").html(json.ganmao);
if(json.aqi!=undefined){
$("#aqi").html("实时空气质量:" json.aqi);
}else{
$("#aqi").html("");
}
var forecast=json.forecast;
for(var i=0;i<forecast.length;i ){
date[i]=forecast[i].date;
fengxiang[i]=forecast[i].fengxiang;
fengli[i]=forecast[i].fengli;
high[i]=forecast[i].high.substring(3,6);
high2[i]=(forecast[i].high).substring(3,5);
low[i]=forecast[i].low.substring(3,6);
low2[i]=forecast[i].low.substring(3,5);
type[i]=forecast[i].type;
}
bgFun(type[0]);
for(var j=0;j<forecast.length;j ){
idType[j].html(thisDate "月" date[j]);
subzero[j].html(low[j]);
heat[j].html(high[j]);
tqtype[j].html(type[j]);
lixiang[j].html(fengxiang[j] fengli[j]);
}
typeFun(type[0],img1);
typeFun(type[1],img2);
typeFun(type[2],img3);
typeFun(type[3],img4);
typeFun(type[4],img5);
var myChart = echarts.init(document.getElementById('myChart'));
var option = {
chart: {
backgroundColor: '#f2f2f2',
style: {
fontFamily: "Microsoft YaHei UI",
fontSize: '12px',
fontWeight: 'bold',
color: '#006cee'
}
},
title: {
text: '未来五天的天气情况',
subtext: '温度趋势'
},
tooltip: {
trigger: 'axis'
},
legend: {
data: ['最高气温', '最低气温']
},
toolbox: {
toolbox: {
show: true,
feature: {
dataZoom: {
yAxisIndex: 'none'
},
dataView: {readOnly: false},
magicType: {type: ['line', 'bar']},
restore: {},
saveAsImage: {}
}
}
},
xAxis: [
{
type: 'category',
boundaryGap: false,
data: date
}
],
yAxis: [
{
type: 'value',
axisLabel: {
formatter: '{value} ℃'
}
}
],
series: [
{
type: 'line',
name: '最高气温',
color: '#C90000',
data: high2
},
{
type: 'line',
name: '最低气温',
color: '#239B0E',
data: low2
}
]
};
myChart.setOption(option);
}else{
alert("获取数据错误")
}
}
});
});
}
function closeFun() {
$("#province").html("");
$("#city").html("");
$(".cityBox").hide();
}
</script>
<div style="text-align:center;margin:50px 0; font:normal 14px/24px 'MicroSoft YaHei';">
</div>
</body>
</html>
相关软件
小贴士
感谢您为本站写下的评论,您的评论对其它用户来说具有重要的参考价值,所以请认真填写。
- 类似“顶”、“沙发”之类没有营养的文字,对勤劳贡献的楼主来说是令人沮丧的反馈信息。
- 相信您也不想看到一排文字/表情墙,所以请不要反馈意义不大的重复字符,也请尽量不要纯表情的回复。
- 提问之前请再仔细看一遍楼主的说明,或许是您遗漏了。
- 请勿到处挖坑绊人、招贴广告。既占空间让人厌烦,又没人会搭理,于人于己都无利。
关于好例子网
本站旨在为广大IT学习爱好者提供一个非营利性互相学习交流分享平台。本站所有资源都可以被免费获取学习研究。本站资源来自网友分享,对搜索内容的合法性不具有预见性、识别性、控制性,仅供学习研究,请务必在下载后24小时内给予删除,不得用于其他任何用途,否则后果自负。基于互联网的特殊性,平台无法对用户传输的作品、信息、内容的权属或合法性、安全性、合规性、真实性、科学性、完整权、有效性等进行实质审查;无论平台是否已进行审查,用户均应自行承担因其传输的作品、信息、内容而可能或已经产生的侵权或权属纠纷等法律责任。本站所有资源不代表本站的观点或立场,基于网友分享,根据中国法律《信息网络传播权保护条例》第二十二与二十三条之规定,若资源存在侵权或相关问题请联系本站客服人员,点此联系我们。关于更多版权及免责申明参见 版权及免责申明

网友评论
我要评论