
实例介绍
【实例简介】
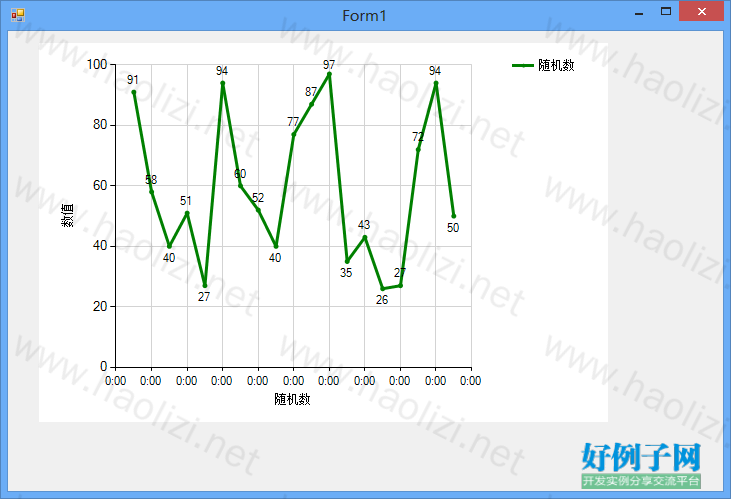
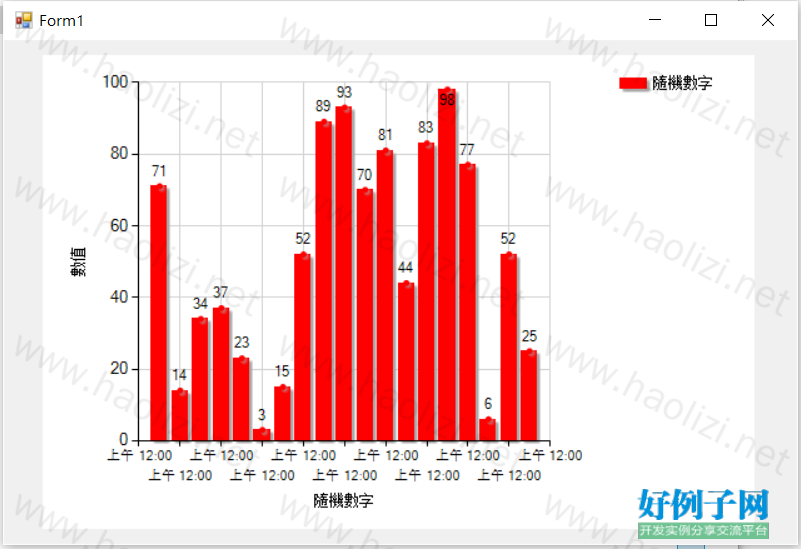
MS Chart Control 學習手記 - 長條圖
客戶希望可以針對資料庫裡面的資料產生出曲線圖、直條圖、橫條圖、立體直條圖、立體橫條圖、圓餅圖、立體圓餅圖
【实例截图】
【核心代码】
using System;
using System.Collections.Generic;
using System.ComponentModel;
using System.Data;
using System.Drawing;
using System.Linq;
using System.Text;
using System.Windows.Forms;
using System.Windows.Forms.DataVisualization.Charting;
namespace chart
{
public partial class Form1 : Form
{
public Form1()
{
InitializeComponent();
}
private void Form1_Load(object sender, EventArgs e)
{
Chart Chart1 = new Chart();
Chart1.ChartAreas.Add("ChartArea1"); //圖表區域集合
Chart1.Series.Add("隨機數字"); //數據序列集合
//設定 Chart
Chart1.Width = 700;
Chart1.Height = 400;
//設置網格的顏色
chart1.ChartAreas["ChartArea1"].AxisX.MajorGrid.LineColor = Color.LightGray;
chart1.ChartAreas["ChartArea1"].AxisY.MajorGrid.LineColor = Color.LightGray;
//設置坐標軸名稱
chart1.ChartAreas["ChartArea1"].AxisX.Title = "隨機數字";
chart1.ChartAreas["ChartArea1"].AxisY.Title = "數值";
//啟用3D顯示
chart1.ChartAreas["ChartArea1"].Area3DStyle.Enable3D = false;
//////////////////////Series屬性設置///////////////////////////
//設置顯示類型-線型
//chart1.Series["隨機數字"].ChartType = SeriesChartType.Line;
chart1.Series["隨機數字"].ChartType = SeriesChartType.Column;
//設置坐標軸Value顯示類型
chart1.Series["隨機數字"].XValueType = ChartValueType.Time;
//是否顯示標籤的數值
chart1.Series["隨機數字"].IsValueShownAsLabel = true;
chart1.Series["隨機數字"].MarkerStyle = MarkerStyle.Circle; //設置標記圖案
chart1.Series["隨機數字"].Color = Color.Red; //設置圖案顏色
chart1.Series["隨機數字"].BorderWidth = 3; //設置圖案的寬度
chart1.Series["隨機數字"].ShadowColor = Color.DarkGray; // 陰影的顏色
chart1.Series["隨機數字"].ShadowOffset = 2; // 陰影位置的角度
//添加隨機數字
Random rd = new Random();
for (int i = 1; i < 20; i )
{
chart1.Series["隨機數字"].Points.AddXY(i, rd.Next(100));
}
//string[] xValues = { "數值1", "數值2" };
//string[] titleArr = { "活動1", "活動2" };
//int[] yValues = { 269000, 94 };
//int[] yValues2 = { 120300, 116 };
////ChartAreas,Series,Legends 基本設定--------------------------------------------------
//Chart Chart1 = new Chart();
//Chart1.ChartAreas.Add("ChartArea1"); //圖表區域集合
//Chart1.Series.Add("Series1"); //數據序列集合
//Chart1.Series.Add("Series2");
//Chart1.Legends.Add("Legends1"); //圖例集合
////設定 Chart
//Chart1.Width = 700;
//Chart1.Height = 400;
//Title title = new Title();
//title.Text = "長條圖";
//title.Alignment = ContentAlignment.MiddleCenter;
//title.Font = new System.Drawing.Font("Trebuchet MS", 14F, FontStyle.Bold);
//Chart1.Titles.Add(title);
////設定 ChartArea----------------------------------------------------------------------
//Chart1.ChartAreas["ChartArea1"].Area3DStyle.Enable3D = true; //3D效果
//Chart1.ChartAreas["ChartArea1"].Area3DStyle.IsClustered = true; //並排顯示
//Chart1.ChartAreas["ChartArea1"].Area3DStyle.Rotation = 40; //垂直角度
//Chart1.ChartAreas["ChartArea1"].Area3DStyle.Inclination = 50; //水平角度
//Chart1.ChartAreas["ChartArea1"].Area3DStyle.PointDepth = 30; //數據條深度
//Chart1.ChartAreas["ChartArea1"].Area3DStyle.WallWidth = 0; //外牆寬度
//Chart1.ChartAreas["ChartArea1"].Area3DStyle.LightStyle = LightStyle.Realistic; //光源
//Chart1.ChartAreas["ChartArea1"].BackColor = Color.FromArgb(240, 240, 240); //背景色
//Chart1.ChartAreas["ChartArea1"].AxisX2.Enabled = AxisEnabled.False; //隱藏 X2 標示
//Chart1.ChartAreas["ChartArea1"].AxisY2.Enabled = AxisEnabled.False; //隱藏 Y2 標示
//Chart1.ChartAreas["ChartArea1"].AxisY2.MajorGrid.Enabled = false; //隱藏 Y2 軸線
////Y 軸線顏色
//Chart1.ChartAreas["ChartArea1"].AxisY.MajorGrid.LineColor = Color.FromArgb(150, 150, 150);
////X 軸線顏色
//Chart1.ChartAreas["ChartArea1"].AxisX.MajorGrid.LineColor = Color.FromArgb(150, 150, 150);
//Chart1.ChartAreas["ChartArea1"].AxisY.LabelStyle.Format = "#,###";
////Chart1.ChartAreas["ChartArea1"].AxisY2.Maximum = 160;
////Chart1.ChartAreas["ChartArea1"].AxisY2.Interval = 20;
////設定 Legends------------------------------------------------------------------------
//Chart1.Legends["Legends1"].DockedToChartArea = "ChartArea1"; //顯示在圖表內
////Chart1.Legends["Legends1"].Docking = Docking.Bottom; //自訂顯示位置
//Chart1.Legends["Legends1"].BackColor = Color.FromArgb(235, 235, 235); //背景色
////斜線背景
//Chart1.Legends["Legends1"].BackHatchStyle = ChartHatchStyle.DarkDownwardDiagonal;
//Chart1.Legends["Legends1"].BorderWidth = 1;
//Chart1.Legends["Legends1"].BorderColor = Color.FromArgb(200, 200, 200);
////設定 Series-----------------------------------------------------------------------
//Chart1.Series["Series1"].ChartType = SeriesChartType.Column; //直條圖
////Chart1.Series["Series1"].ChartType = SeriesChartType.Bar; //橫條圖
//Chart1.Series["Series1"].Points.DataBindXY(xValues, yValues);
//Chart1.Series["Series1"].Legend = "Legends1";
//Chart1.Series["Series1"].LegendText = titleArr[0];
//Chart1.Series["Series1"].LabelFormat = "#,###"; //金錢格式
//Chart1.Series["Series1"].MarkerSize = 8; //Label 範圍大小
//Chart1.Series["Series1"].LabelForeColor = Color.FromArgb(0, 90, 255); //字體顏色
////字體設定
//Chart1.Series["Series1"].Font = new System.Drawing.Font("Trebuchet MS", 10, System.Drawing.FontStyle.Bold);
////Label 背景色
//Chart1.Series["Series1"].LabelBackColor = Color.FromArgb(150, 255, 255, 255);
//Chart1.Series["Series1"].Color = Color.FromArgb(240, 65, 140, 240); //背景色
//Chart1.Series["Series1"].IsValueShownAsLabel = true; // Show data points labels
//Chart1.Series["Series2"].Points.DataBindXY(xValues, yValues2);
//Chart1.Series["Series2"].Legend = "Legends1";
//Chart1.Series["Series2"].LegendText = titleArr[1];
//Chart1.Series["Series2"].LabelFormat = "#,###"; //金錢格式
//Chart1.Series["Series2"].MarkerSize = 8; //Label 範圍大小
//Chart1.Series["Series2"].LabelForeColor = Color.FromArgb(255, 103, 0);
//Chart1.Series["Series2"].Font = new System.Drawing.Font("Trebuchet MS", 10, FontStyle.Bold);
//Chart1.Series["Series2"].LabelBackColor = Color.FromArgb(150, 255, 255, 255);
//Chart1.Series["Series2"].Color = Color.FromArgb(240, 252, 180, 65); //背景色
//Chart1.Series["Series2"].IsValueShownAsLabel = true; //顯示數據
}
}
}
标签: chart
相关软件
小贴士
感谢您为本站写下的评论,您的评论对其它用户来说具有重要的参考价值,所以请认真填写。
- 类似“顶”、“沙发”之类没有营养的文字,对勤劳贡献的楼主来说是令人沮丧的反馈信息。
- 相信您也不想看到一排文字/表情墙,所以请不要反馈意义不大的重复字符,也请尽量不要纯表情的回复。
- 提问之前请再仔细看一遍楼主的说明,或许是您遗漏了。
- 请勿到处挖坑绊人、招贴广告。既占空间让人厌烦,又没人会搭理,于人于己都无利。
关于好例子网
本站旨在为广大IT学习爱好者提供一个非营利性互相学习交流分享平台。本站所有资源都可以被免费获取学习研究。本站资源来自网友分享,对搜索内容的合法性不具有预见性、识别性、控制性,仅供学习研究,请务必在下载后24小时内给予删除,不得用于其他任何用途,否则后果自负。基于互联网的特殊性,平台无法对用户传输的作品、信息、内容的权属或合法性、安全性、合规性、真实性、科学性、完整权、有效性等进行实质审查;无论平台是否已进行审查,用户均应自行承担因其传输的作品、信息、内容而可能或已经产生的侵权或权属纠纷等法律责任。本站所有资源不代表本站的观点或立场,基于网友分享,根据中国法律《信息网络传播权保护条例》第二十二与二十三条之规定,若资源存在侵权或相关问题请联系本站客服人员,点此联系我们。关于更多版权及免责申明参见 版权及免责申明

网友评论
我要评论