【实例简介】Mastering Tableau 2021 (Marleen Meier, David Baldwin) (z-lib.org)
Implement advanced business intelligence techniques
and analytics with Tableau
【实例截图】






【核心代码】
Table of Contents
Preface
ix
Chapter 1: Getting Up to Speed – A Review of the Basics
1
Creating worksheets and dashboards
2
Creating worksheets
2
Creating a visualization
3
Beyond the default behavior
6
Show Me
12
Creating dashboards
13
Building a dashboard
14
Adding interactivity to a dashboard
18
Connecting Tableau to your data
22
Connecting to a file
23
Connecting to Tableau Server
24
Connecting to saved data sources
26
Measure Names and Measure Values
28
Measure Names and Measure Values shortcuts
31
Three essential Tableau concepts
34
Dimensions and measures
35
Row-level, aggregate-level, and table-level calculations
36
Continuous and discrete
39
Exporting data to other devices
43
Exporting data to a mobile phone
43
Tableau Mobile
45
Summary
47
Chapter 2: All About Data – Getting Your Data Ready
49
Understanding Hyper
50
The Tableau data-handling engine
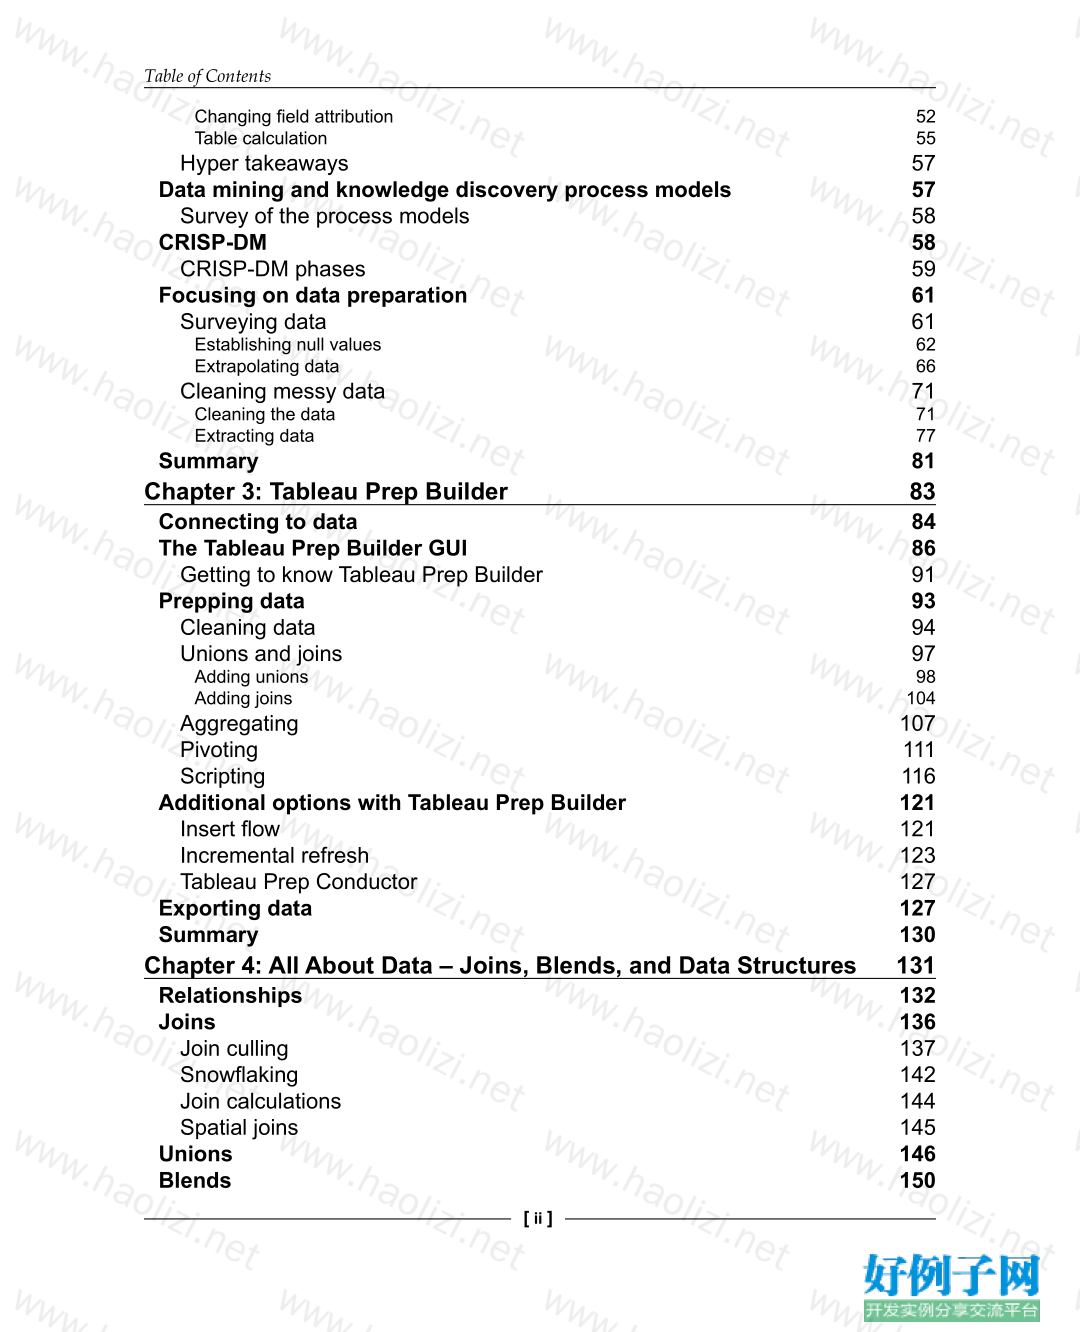
50Table of Contents
[ ii ]
Changing field attribution
52
Table calculation
55
Hyper takeaways
57
Data mining and knowledge discovery process models
57
Survey of the process models
58
CRISP-DM
58
CRISP-DM phases
59
Focusing on data preparation
61
Surveying data
61
Establishing null values
62
Extrapolating data
66
Cleaning messy data
71
Cleaning the data
71
Extracting data
77
Summary
81
Chapter 3: Tableau Prep Builder
83
Connecting to data
84
The Tableau Prep Builder GUI
86
Getting to know Tableau Prep Builder
91
Prepping data
93
Cleaning data
94
Unions and joins
97
Adding unions
98
Adding joins
104
Aggregating
107
Pivoting
111
Scripting
116
Additional options with Tableau Prep Builder
121
Insert flow
121
Incremental refresh
123
Tableau Prep Conductor
127
Exporting data
127
Summary
130
Chapter 4: All About Data – Joins, Blends, and Data Structures 131
Relationships
132
Joins
136
Join culling
137
Snowflaking
142
Join calculations
144
Spatial joins
145
Unions
146
Blends
150Table of Contents
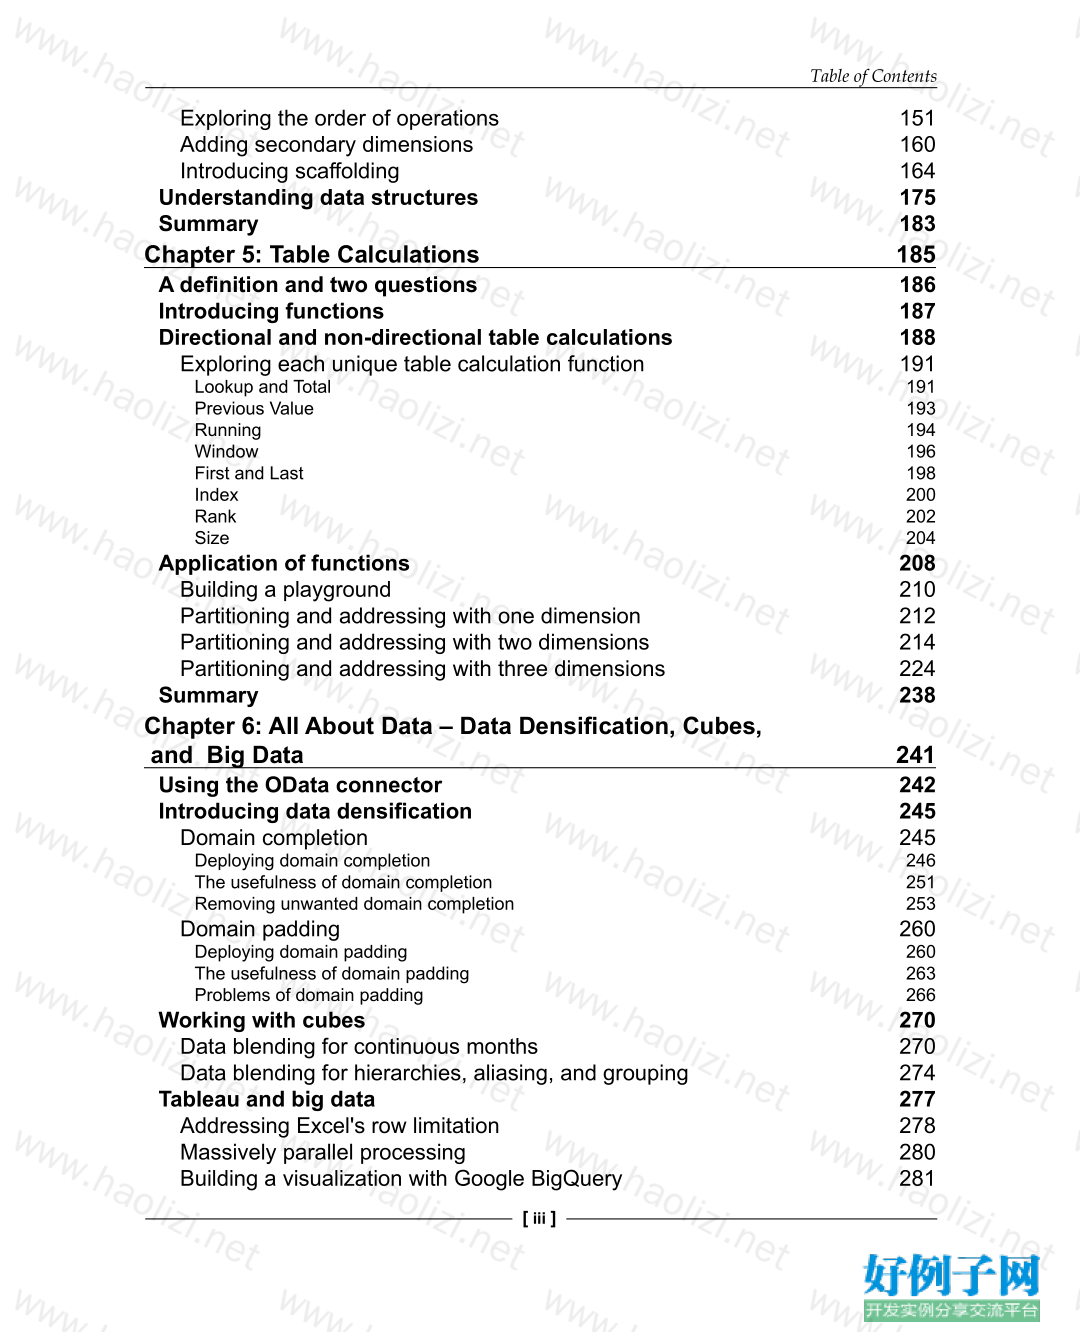
[ iii ]
Exploring the order of operations
151
Adding secondary dimensions
160
Introducing scaffolding
164
Understanding data structures
175
Summary
183
Chapter 5: Table Calculations
185
A definition and two questions
186
Introducing functions
187
Directional and non-directional table calculations
188
Exploring each unique table calculation function
191
Lookup and Total
191
Previous Value
193
Running
194
Window
196
First and Last
198
Index
200
Rank
202
Size
204
Application of functions
208
Building a playground
210
Partitioning and addressing with one dimension
212
Partitioning and addressing with two dimensions
214
Partitioning and addressing with three dimensions
224
Summary
238
Chapter 6: All About Data – Data Densification, Cubes,
and Big Data
241
Using the OData connector
242
Introducing data densification
245
Domain completion
245
Deploying domain completion
246
The usefulness of domain completion
251
Removing unwanted domain completion
253
Domain padding
260
Deploying domain padding
260
The usefulness of domain padding
263
Problems of domain padding
266
Working with cubes
270
Data blending for continuous months
270
Data blending for hierarchies, aliasing, and grouping
274
Tableau and big data
277
Addressing Excel's row limitation
278
Massively parallel processing
280
Building a visualization with Google BigQuery
281Table of Contents
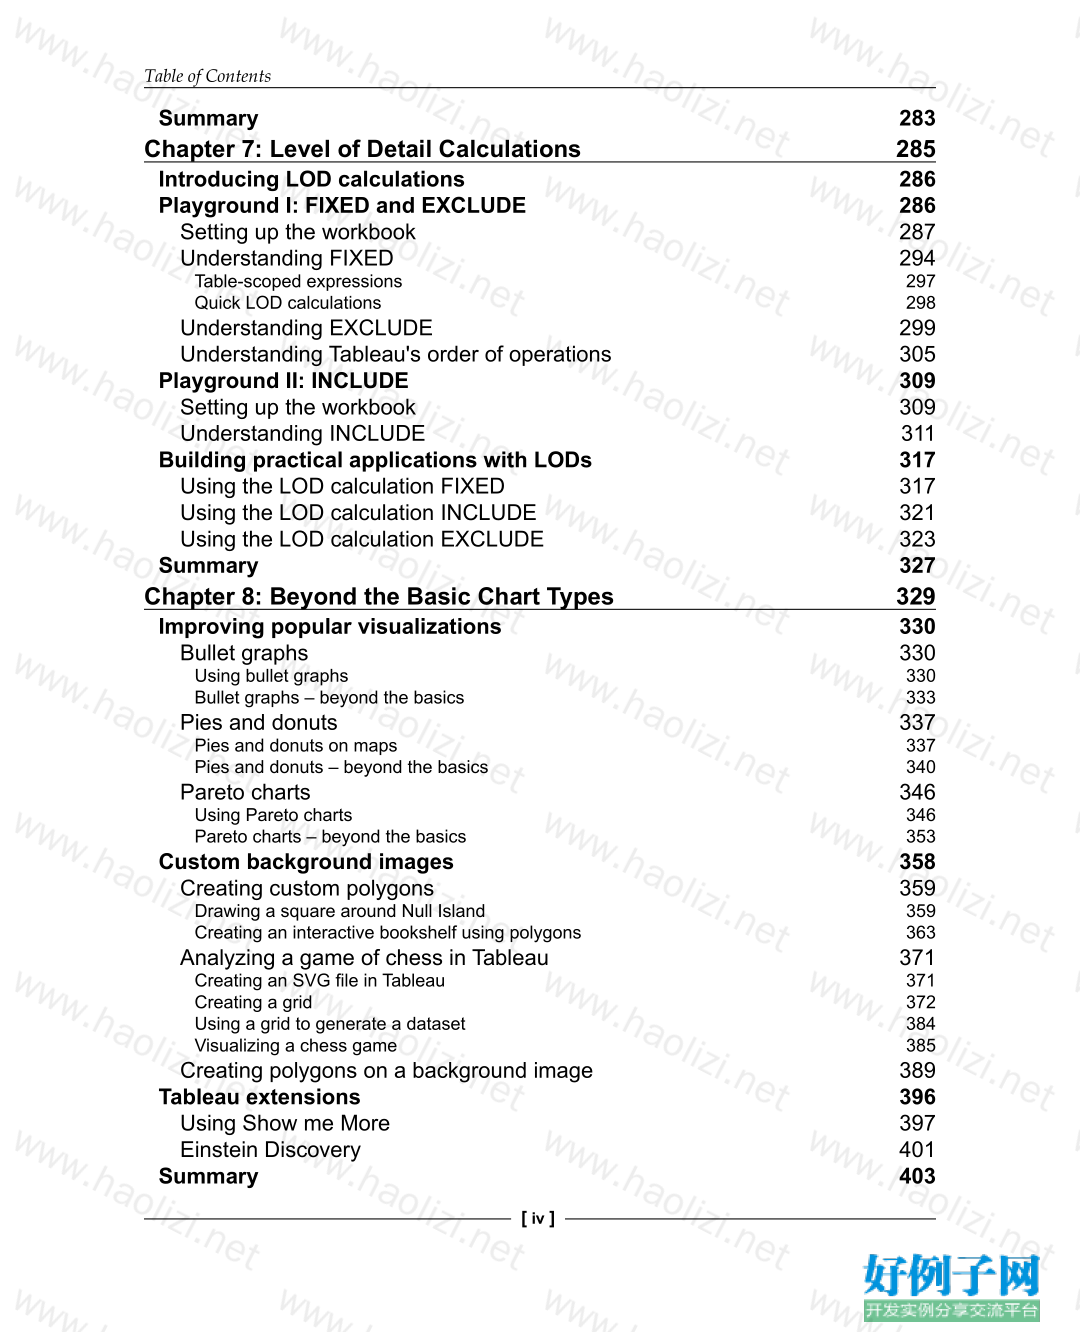
[ iv ]
Summary
283
Chapter 7: Level of Detail Calculations
285
Introducing LOD calculations
286
Playground I: FIXED and EXCLUDE
286
Setting up the workbook
287
Understanding FIXED
294
Table-scoped expressions
297
Quick LOD calculations
298
Understanding EXCLUDE
299
Understanding Tableau's order of operations
305
Playground II: INCLUDE
309
Setting up the workbook
309
Understanding INCLUDE
311
Building practical applications with LODs
317
Using the LOD calculation FIXED
317
Using the LOD calculation INCLUDE
321
Using the LOD calculation EXCLUDE
323
Summary
327
Chapter 8: Beyond the Basic Chart Types
329
Improving popular visualizations
330
Bullet graphs
330
Using bullet graphs
330
Bullet graphs – beyond the basics
333
Pies and donuts
337
Pies and donuts on maps
337
Pies and donuts – beyond the basics
340
Pareto charts
346
Using Pareto charts
346
Pareto charts – beyond the basics
353
Custom background images
358
Creating custom polygons
359
Drawing a square around Null Island
359
Creating an interactive bookshelf using polygons
363
Analyzing a game of chess in Tableau
371
Creating an SVG file in Tableau
371
Creating a grid
372
Using a grid to generate a dataset
384
Visualizing a chess game
385
Creating polygons on a background image
389
Tableau extensions
396
Using Show me More
397
Einstein Discovery
401
Summary
403Table of Contents
[ v ]
Chapter 9: Mapping
405
Extending Tableau's mapping capabilities without leaving Tableau
406
Creating custom polygons
413
Polygons for Texas
415
Heatmaps
420
Dual axes and layering maps
422
Using dual axes
422
Adding map layers
426
Extending Tableau mapping with other technology
438
Using custom maps with a Web Map Service
438
Exploring Mapbox
441
Swapping maps
444
Summary
448
Chapter 10: Tableau for Presentations
449
Getting the best images out of Tableau
450
Tableau's native export capabilities
450
From Tableau to PowerPoint
451
Creating a template
453
Creating a dashboard for print
460
Semi-automating a PowerPoint presentation
462
Embedding Tableau in PowerPoint
464
Animating Tableau
472
Using an animation to export many images
477
Using an animation in Tableau to create an animation in PowerPoint
480
Story points and dashboards for presentations
481
Presentation resources
482
Summary
483
Chapter 11: Visualization Best Practices and Dashboard Design 485
Visualization design theory
486
Formatting rules
486
Keep the font choice simple
486
Use lines in order of visibility
487
Use bands in groups of three to five
488
Color rules
489
Keep colors simple and limited
489
Respect the psychological implications of colors
489
Be colorblind-friendly
490
Use pure colors sparingly
490
Choose color variations over symbol variation
491
Visualization type rules
492Table of Contents
[ vi ]
Keep shapes simple
493
Use pie charts sparingly
495
Compromises
496
Making the dashboard simple and robust
496
Presenting dense information
497
Telling a story
498
Maximizing documentation on a dashboard
499
Keeping visualizations simple
501
Dashboard design
502
Dashboard layout
503
The golden ratio layout
503
The quad layout
506
The small multiple layout
506
Utilizing sheet swapping
507
Creating a collapsible menu
513
Dashboard best practices for user experience
525
Actions
525
Filter actions
525
Highlight actions
530
URL actions
532
Navigation actions
534
Parameter actions
536
Set actions
539
Export Dashboard Button
543
Item hierarchy
544
Used In
545
Summary
546
Chapter 12: Advanced Analytics
547
Visualizing world indices correlations
548
Plotting a scattergraph
548
Adding axis distributions
561
Adding a correlation matrix
570
Finalizing the dashboard
574
Geo-spatial analytics with Chicago traffic violations
579
Preparing the data
580
Building a map of intersections
583
Adding a corresponding heatmap worksheet
589
Finalizing the dashboard
591
Extending geo-spatial analytics with distance measures
592
Adding measure points to the map
595
Adding the distance line
599
Summary
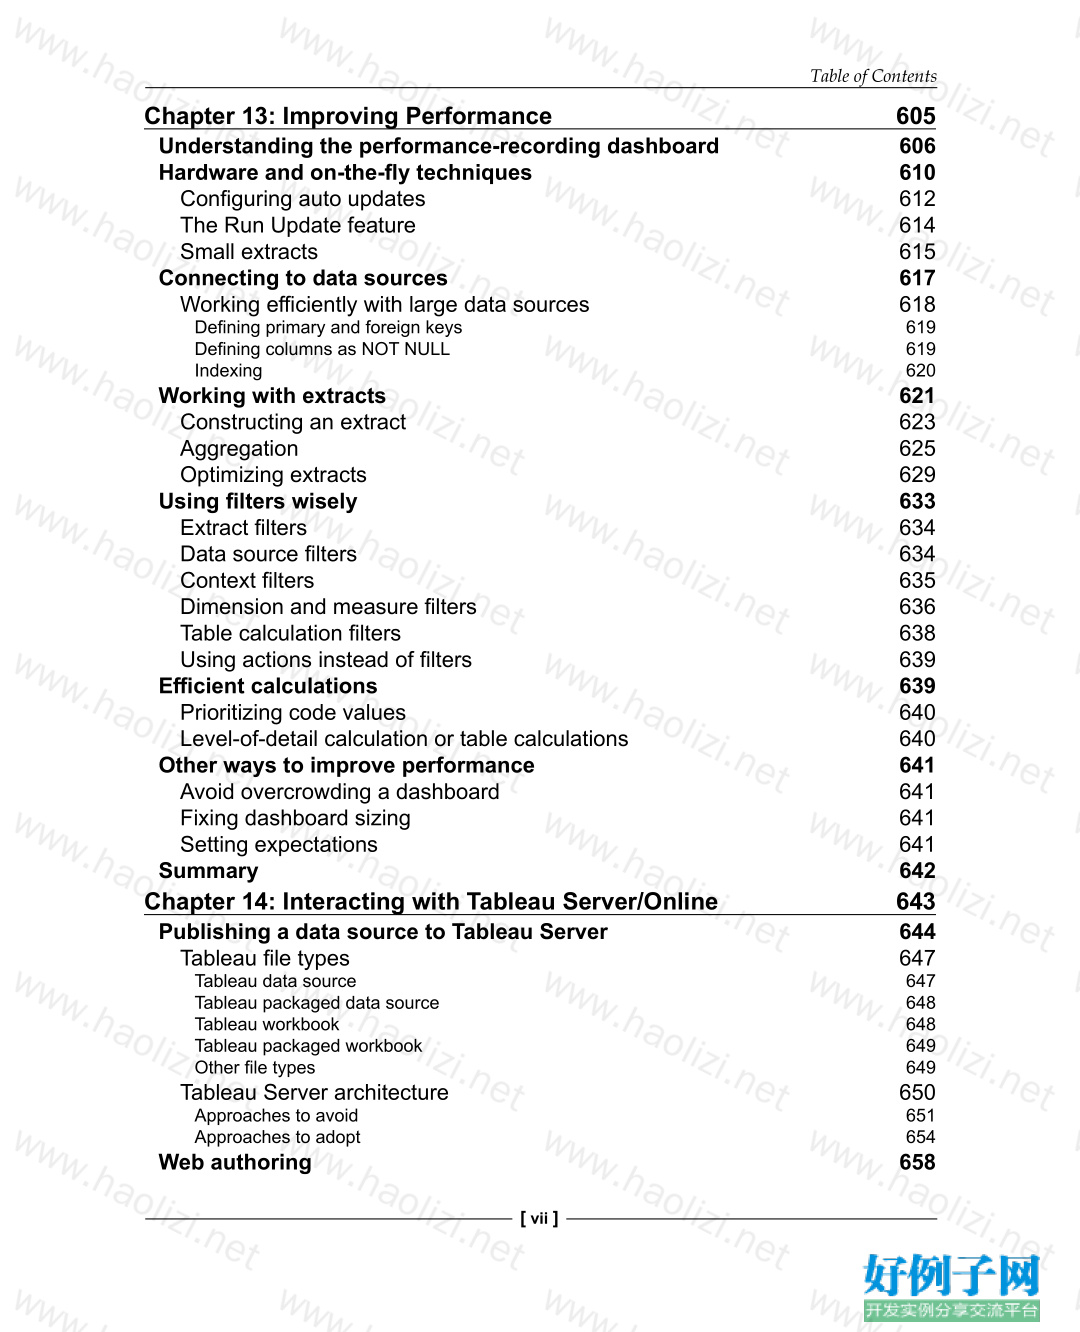
603Table of Contents
[ vii ]
Chapter 13: Improving Performance
605
Understanding the performance-recording dashboard
606
Hardware and on-the-fly techniques
610
Configuring auto updates
612
The Run Update feature
614
Small extracts
615
Connecting to data sources
617
Working efficiently with large data sources
618
Defining primary and foreign keys
619
Defining columns as NOT NULL
619
Indexing
620
Working with extracts
621
Constructing an extract
623
Aggregation
625
Optimizing extracts
629
Using filters wisely
633
Extract filters
634
Data source filters
634
Context filters
635
Dimension and measure filters
636
Table calculation filters
638
Using actions instead of filters
639
Efficient calculations
639
Prioritizing code values
640
Level-of-detail calculation or table calculations
640
Other ways to improve performance
641
Avoid overcrowding a dashboard
641
Fixing dashboard sizing
641
Setting expectations
641
Summary
642
Chapter 14: Interacting with Tableau Server/Online
643
Publishing a data source to Tableau Server
644
Tableau file types
647
Tableau data source
647
Tableau packaged data source
648
Tableau workbook
648
Tableau packaged workbook
649
Other file types
649
Tableau Server architecture
650
Approaches to avoid
651
Approaches to adopt
654
Web authoring
658Table of Contents
[ viii ]
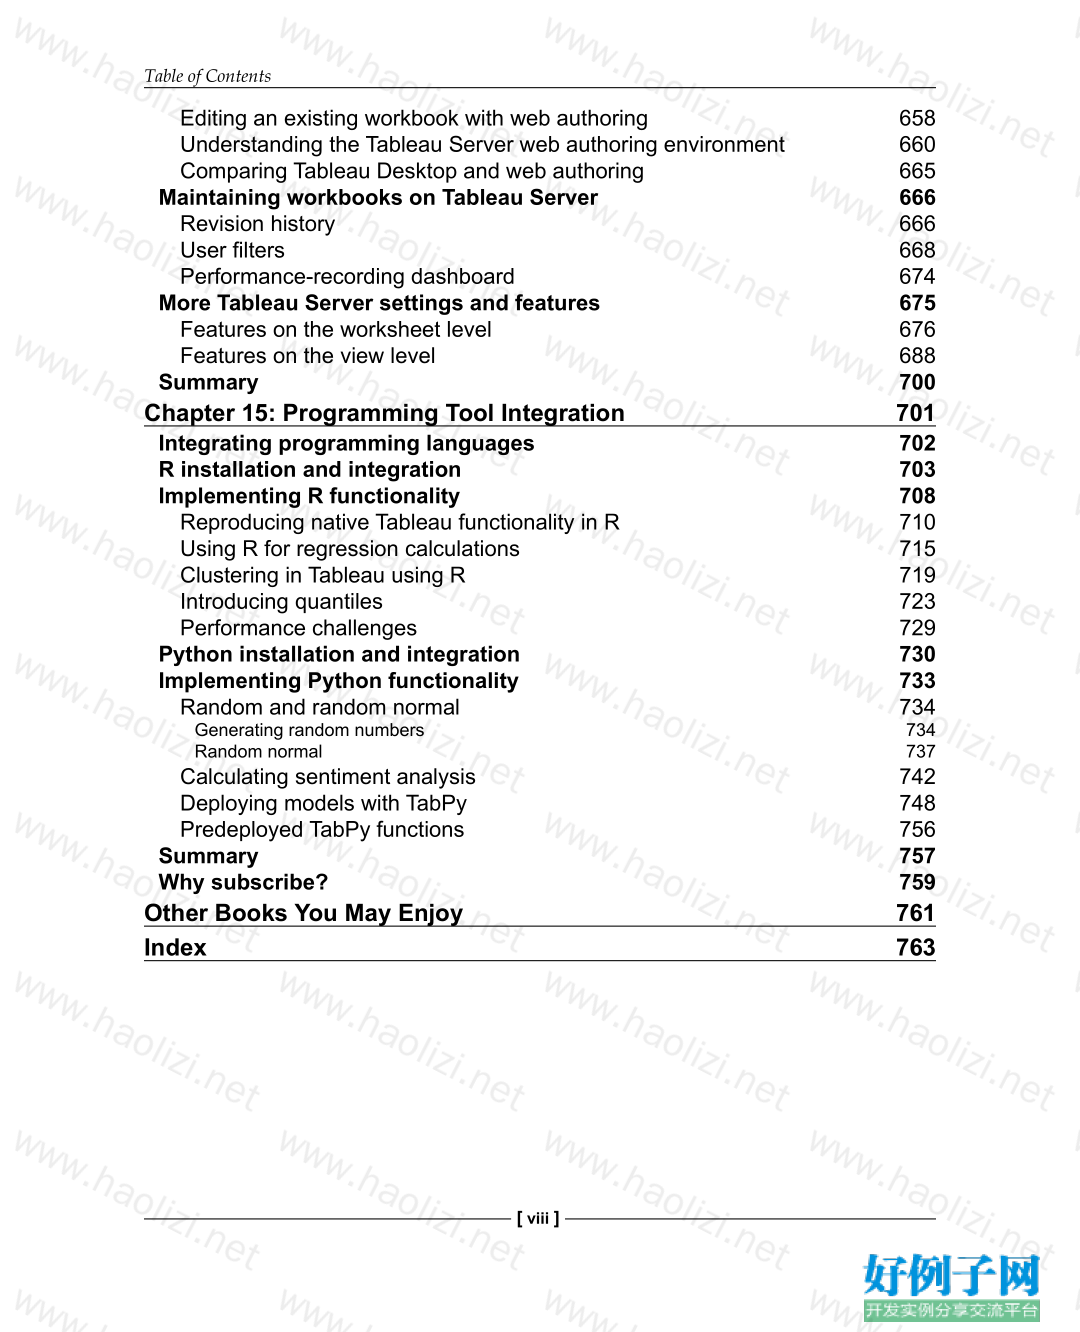
Editing an existing workbook with web authoring
658
Understanding the Tableau Server web authoring environment
660
Comparing Tableau Desktop and web authoring
665
Maintaining workbooks on Tableau Server
666
Revision history
666
User filters
668
Performance-recording dashboard
674
More Tableau Server settings and features
675
Features on the worksheet level
676
Features on the view level
688
Summary
700
Chapter 15: Programming Tool Integration
701
Integrating programming languages
702
R installation and integration
703
Implementing R functionality
708
Reproducing native Tableau functionality in R
710
Using R for regression calculations
715
Clustering in Tableau using R
719
Introducing quantiles
723
Performance challenges
729
Python installation and integration
730
Implementing Python functionality
733
Random and random normal
734
Generating random numbers
734
Random normal
737
Calculating sentiment analysis
742
Deploying models with TabPy
748
Predeployed TabPy functions
756
Summary
757
Why subscribe?
759
Other Books You May Enjoy
761
Index
763


网友评论
我要评论