实例介绍
【实例简介】
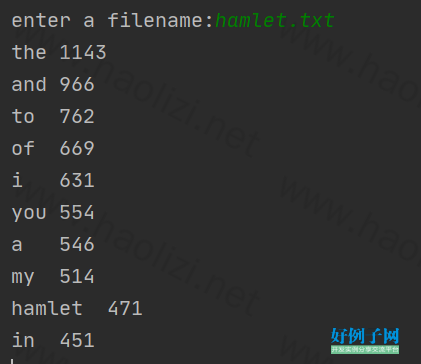
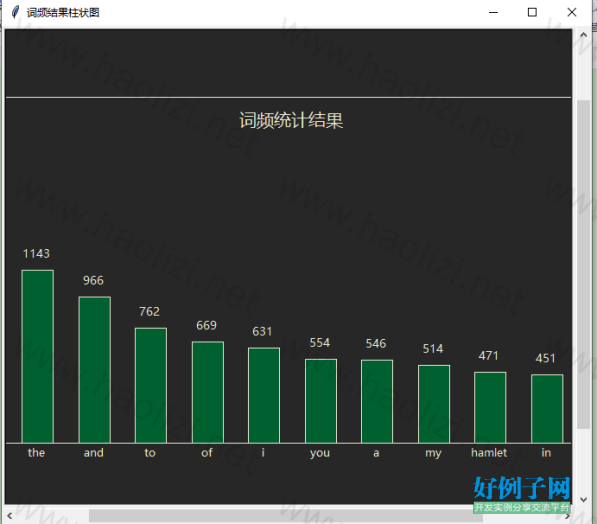
使用python画条形统计图
【实例截图】


【核心代码】
import turtle
'''全局变量'''
amount = 10
words = []
wCounts = []
xPoint = -360
yPoint = -200
'''turtle start'''
def drawLine(t,x1,y1,x2,y2):
t.penup()
t.goto(x1,y1)
t.pendown()
t.goto(x2,y2)
def drawText(t,x,y,text,fontSize=10):
t.penup()
t.goto(x,y)
t.pendown()
t.write(text,font=('微软雅黑',fontSize,),align='center')
def drawRectangle(t,x,y,rWidth):
drawLine(t,x-rWidth,yPoint,x-rWidth,y)
drawLine(t,x-rWidth,y,x rWidth,y)
drawLine(t,x rWidth,y,x rWidth,yPoint)
drawLine(t,x rWidth,yPoint,x-rWidth,yPoint)
def drawBarchart(t):
drawText(t,0,-yPoint-40,"词频统计结果",15)
drawRectangle(t,0,-yPoint,-xPoint)
rWidth = -xPoint/(2*amount)
xScale = -xPoint*2/(amount 1)
yScale = -yPoint/wCounts[0]
for i in range(amount):
i=i 1
x=i*xScale xPoint
y=wCounts[i-1]*yScale yPoint
drawText(t,x,yPoint-20,words[i-1])
drawText(t,x,y 10,wCounts[i-1])
t.begin_fill()
drawRectangle(t,x,y,rWidth)
t.end_fill()
def init():
turtle.title('词频结果柱状图')
turtle.screensize(900,750,"#272727")
t=turtle.Turtle()
t.hideturtle()
t.width(1)
t.color("#EBEBD0","#006030")
drawBarchart(t)
turtle.exitonclick()
'''data Processing'''
def processLine(line,wordamounts):
line = replacePunctuations(line)
words = line.split()
for word in words:
if word in wordamounts:
wordamounts[word] = 1
else:
wordamounts[word] = 1
#空格替换标点
def replacePunctuations(line):
for ch in line:
if ch in "~!@#$%^&*()-_ =<>?/,.:;{}[]|\'\"":
line = line.replace(ch,' ')
return line
def dataProcess(filename):
infile=open(filename,'r',encoding='UTF-8')
wordamounts={}
for line in infile:
processLine(line.lower(),wordamounts)
pairs = list(wordamounts.items())
items = [[x,y]for (y,x) in pairs]
items.sort()
for i in range(len(items)-1,len(items)-amount-1,-1):
print(items[i][1] "\t" str(items[i][0]))
wCounts.append(items[i][0])
words.append(items[i][1])
infile.close()
def main():
filename= input("enter a filename:").strip()
dataProcess(filename)
init()
if __name__ == '__main__':
main()
小贴士
感谢您为本站写下的评论,您的评论对其它用户来说具有重要的参考价值,所以请认真填写。
- 类似“顶”、“沙发”之类没有营养的文字,对勤劳贡献的楼主来说是令人沮丧的反馈信息。
- 相信您也不想看到一排文字/表情墙,所以请不要反馈意义不大的重复字符,也请尽量不要纯表情的回复。
- 提问之前请再仔细看一遍楼主的说明,或许是您遗漏了。
- 请勿到处挖坑绊人、招贴广告。既占空间让人厌烦,又没人会搭理,于人于己都无利。
关于好例子网
本站旨在为广大IT学习爱好者提供一个非营利性互相学习交流分享平台。本站所有资源都可以被免费获取学习研究。本站资源来自网友分享,对搜索内容的合法性不具有预见性、识别性、控制性,仅供学习研究,请务必在下载后24小时内给予删除,不得用于其他任何用途,否则后果自负。基于互联网的特殊性,平台无法对用户传输的作品、信息、内容的权属或合法性、安全性、合规性、真实性、科学性、完整权、有效性等进行实质审查;无论平台是否已进行审查,用户均应自行承担因其传输的作品、信息、内容而可能或已经产生的侵权或权属纠纷等法律责任。本站所有资源不代表本站的观点或立场,基于网友分享,根据中国法律《信息网络传播权保护条例》第二十二与二十三条之规定,若资源存在侵权或相关问题请联系本站客服人员,点此联系我们。关于更多版权及免责申明参见 版权及免责申明


网友评论
我要评论